
- Moving the Markets
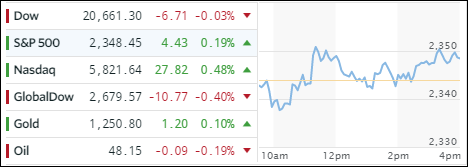
Since market participants did not show much commitment one way or the other, the major indexes ended up hovering slightly above and below the unchanged line but managed to close slightly above it except for the Dow, which gave back a tiny -0.03%. Considering yesterday’s sharp selloff, today’s lack of follow through to the downside was an encouraging sign for the bulls in that there may be more upside potential ahead.
The choppiness and uneasiness was caused by uncertainty not only about Trump’s struggle to push through his healthcare bill, with a vote looming on Thursday, but also his ability to successfully promote his promised tax cuts, which were the main cause of the record breaking rally since November.
Interest rates continued their march south as the 10-year US Treasury yield dropped from a recent high of 2.62% to 2.40% meaning that bonds went back into rally mode during the past 1.5 weeks. The dollar slipped again following the recent downward trend, which started in early March, thereby helping gold to score its 5th day of gains in a row and closing above $1,250.
- ETFs in the Spotlight (updated for 2017)
In case you missed the announcement and description of this section, you can read it here again.
It features 10 broadly diversified and sector ETFs from my HighVolume list as posted every Saturday. Furthermore, they are screened for the lowest MaxDD% number meaning they have been showing better resistance to temporary sell offs than all others over the past year.
The below table simply demonstrates the magnitude with which some of the ETFs are fluctuating in regards to their positions above or below their respective individual trend lines (%M/A). A break below, represented by a negative number, shows weakness, while a break above, represented by a positive percentage, shows strength.
For hundreds of ETF choices, be sure to reference Thursday’s StatSheet.
Year to date, here’s how the 2017 candidates have fared so far:
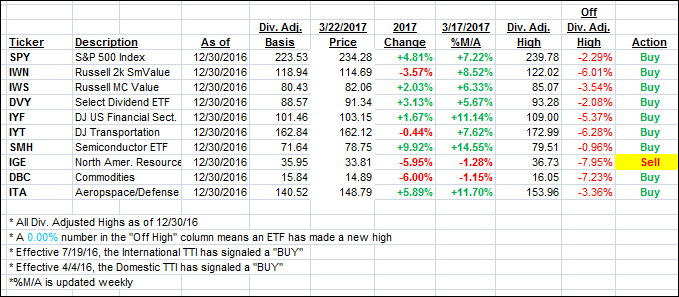
Again, the %M/A column above shows the position of the various ETFs in relation to their respective long term trend lines, while the trailing sell stops are being tracked in the “Off High” column. The “Action” column will signal a “Sell” once the -7.5% point has been taken out in the “Off High” column.
- Trend Tracking Indexes (TTIs)
Our Trend Tracking Indexes (TTIs) rebounded despite the major indexes closing in a mixed fashion.
Here’s how we closed 3/22/2017:
Domestic TTI: +2.36% (last close +2.27%)—Buy signal effective 4/4/2016
International TTI: +5.43% (last close +5.54%)—Buy signal effective 7/19/2016
Disclosure: I am obliged to inform you that I, as well as my advisory clients, own some of the ETFs listed in the above table. Furthermore, they do not represent a specific investment recommendation for you, they merely show which ETFs from the universe I track are falling within the guidelines specified.
Contact Ulli