
- Moving the Markets
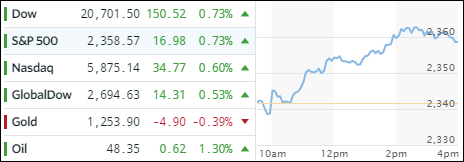
Yesterday, I talked about how the Dow was on its worst losing streak since 1978 if it would hit one more down day. That dubious record was prevented as, right out of the gate this morning, the computer algos went into overdrive by slamming the VIX (volatility index) on 4 different occasions to make sure that the major indexes not just rebounded but also maintained their upward momentum. At the end of the day, all three indices ended solidly in the green, and the mission was accomplished.
The helping headline that Consumer Confidence soared to the highest level since the peak of the dot-com bubble in 2000 gave an assist but had some questioning the accuracy of that statement. Meanwhile, Gallup presented some different numbers as their most recent survey showed that the US Economic Confidence Index (ECI) dropped six points for the week ending March 26, which is the lowest weekly average since the presidential election. Makes me wonder how such divergence is possible.
Across the markets, banks finally managed to pick up some steam after the recent drubbing, the dollar index rallied +0.58% but still stayed below the psychologically important 100 level. Interest rates rose with the 10-Year Treasury gaining 4 points to settle at a yield of 2.42%.
- ETFs in the Spotlight (updated for 2017)
In case you missed the announcement and description of this section, you can read it here again.
It features 10 broadly diversified and sector ETFs from my HighVolume list as posted every Saturday. Furthermore, they are screened for the lowest MaxDD% number meaning they have been showing better resistance to temporary sell offs than all others over the past year.
The below table simply demonstrates the magnitude with which some of the ETFs are fluctuating in regards to their positions above or below their respective individual trend lines (%M/A). A break below, represented by a negative number, shows weakness, while a break above, represented by a positive percentage, shows strength.
For hundreds of ETF choices, be sure to reference Thursday’s StatSheet.
Year to date, here’s how the 2017 candidates have fared so far:
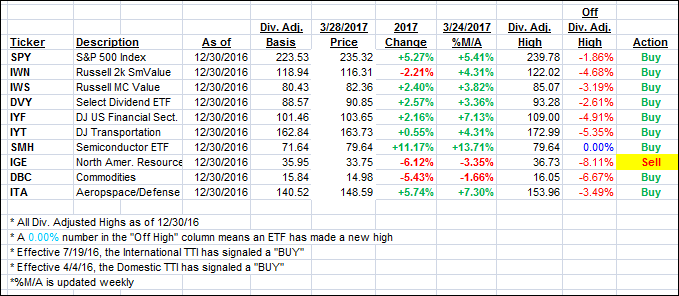
Again, the %M/A column above shows the position of the various ETFs in relation to their respective long term trend lines, while the trailing sell stops are being tracked in the “Off High” column. The “Action” column will signal a “Sell” once the -7.5% point has been taken out in the “Off High” column.
- Trend Tracking Indexes (TTIs)
Our Trend Tracking Indexes (TTIs) closed up as the major indexes snapped out of their recent doldrums.
Here’s how we closed 3/28/2017:
Domestic TTI: +2.44% (last close +2.25%)—Buy signal effective 4/4/2016
International TTI: +5.73% (last close +5.34%)—Buy signal effective 7/19/2016
Disclosure: I am obliged to inform you that I, as well as my advisory clients, own some of the ETFs listed in the above table. Furthermore, they do not represent a specific investment recommendation for you, they merely show which ETFs from the universe I track are falling within the guidelines specified.
Contact Ulli