
- Moving the Markets
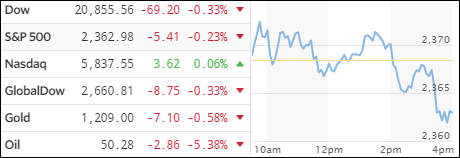
It was another mixed day in the markets as encouraging news via a stronger-than-expected ADP employment report was offset by a collapse in oil prices, which got hammered at the rate of -5.38%, their biggest drop in over a year, caused by a bearish inventory report.
The ADP report showed that private companies added the most jobs in three years in February (280k), which is interpreted as a sign of stronger economic growth. The U.S. government will issue its own broader jobs report on Friday, which will be the last reading before the Fed’s verdict on interest rates due out next week.
The 10-year yield jumped to 2.56% from 2.52% and is now in danger of crossing the 2.6% threshold level, which is widely associated with having a negative effect on equities. Of course, 2.6% is not a hard number, but a yield in the range of 2.6% to 3% is considered a warning sign; sort of the canary in the coalmine.
Ever since Trump’s speech to congress a week ago, the markets have been slipping and sliding, although the magnitude of the retreat has been small and only 0.9% as measured by the Dow. However, the sell-off has been broad based with macro data, emerging markets, copper, high-yield credit, REITs and crude oil all breaking down as “derisking” seems to have been the mantra.
For the time being, however, the major trend in the domestic investment arena, with the exception of a few sectors, remains bullish as my TTI indicator in section 3 below shows.
- ETFs in the Spotlight (updated for 2017)
In case you missed the announcement and description of this section, you can read it here again.
It features 10 broadly diversified and sector ETFs from my HighVolume list as posted every Saturday. Furthermore, they are screened for the lowest MaxDD% number meaning they have been showing better resistance to temporary sell offs than all others over the past year.
The below table simply demonstrates the magnitude with which some of the ETFs are fluctuating in regards to their positions above or below their respective individual trend lines (%M/A). A break below, represented by a negative number, shows weakness, while a break above, represented by a positive percentage, shows strength.
For hundreds of ETF choices, be sure to reference Thursday’s StatSheet.
Year to date, here’s how the 2017 candidates have fared so far:
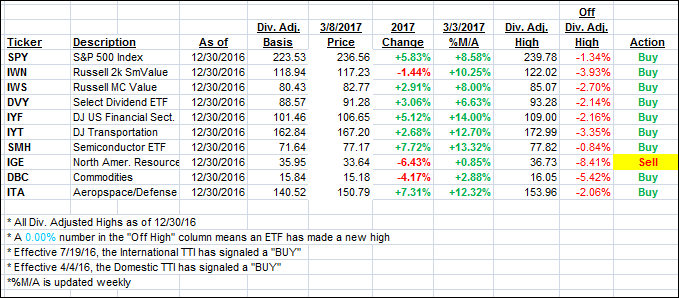
Again, the %M/A column above shows the position of the various ETFs in relation to their respective long term trend lines, while the trailing sell stops are being tracked in the “Off High” column. The “Action” column will signal a “Sell” once the -7.5% point has been taken out in the “Off High” column.
- Trend Tracking Indexes (TTIs)
Our Trend Tracking Indexes (TTIs) edged lower as the markets lacked direction.
Here’s how we closed 3/8/2017:
Domestic TTI: +2.52% (last close +2.62%)—Buy signal effective 4/4/2016
International TTI: +4.89% (last close +4.98%)—Buy signal effective 7/19/2016
Disclosure: I am obliged to inform you that I, as well as my advisory clients, own some of the ETFs listed in the above table. Furthermore, they do not represent a specific investment recommendation for you, they merely show which ETFs from the universe I track are falling within the guidelines specified.
Contact Ulli