
ETF Tracker StatSheet
https://theetfbully.com/2017/03/weekly-statsheet-etf-tracker-newsletter-updated-03162017/
EQUITIES DIP AND DOLLAR PLUNGES
- Moving the Markets
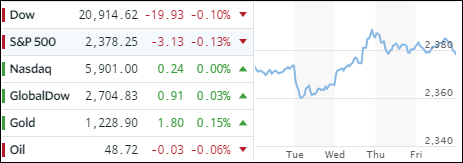
Stocks dipped slightly today but managed to squeeze out a gain for the week with the S&P 500 adding 5 points or 0.2%, which is not a particularly noteworthy performance but, given the uncertainty in Europe along with the Fed’s move on interest rates, we could have ended up far worse.
The US dollar, on the other hand, was not as fortunate and got clobbered resulting in its worst week in some 8 months. It is now down over 3% for this quarter. The yield on the benchmark 10-year Treasury came off its 30-month high of 2.62% and ended down 2.53%, causing a rebound in the bond market. That helped HYG (high yield bond ETF) to recover a bit and bounce of its major support trend line.
Financials had their 2nd worst week of the year while gold remained on its recent bullish path. Today was quadruple option expiration day, which results in higher than normal volume but also tends to distort price levels. With this now behind us, I am curious to see if other main issues such the debt ceiling debate, which certainly will affect market direction, will finally be addressed in the coming weeks.
- ETFs in the Spotlight (updated for 2017)
In case you missed the announcement and description of this section, you can read it here again.
It features 10 broadly diversified and sector ETFs from my HighVolume list as posted every Saturday. Furthermore, they are screened for the lowest MaxDD% number meaning they have been showing better resistance to temporary sell offs than all others over the past year.
The below table simply demonstrates the magnitude with which some of the ETFs are fluctuating in regards to their positions above or below their respective individual trend lines (%M/A). A break below, represented by a negative number, shows weakness, while a break above, represented by a positive percentage, shows strength.
For hundreds of ETF choices, be sure to reference Thursday’s StatSheet.
Year to date, here’s how the 2017 candidates have fared so far:
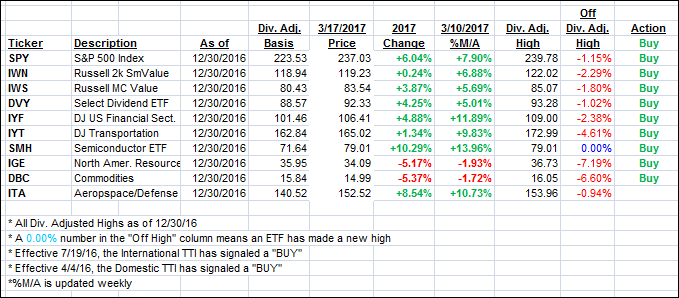
Again, the %M/A column above shows the position of the various ETFs in relation to their respective long term trend lines, while the trailing sell stops are being tracked in the “Off High” column. The “Action” column will signal a “Sell” once the -7.5% point has been taken out in the “Off High” column.
- Trend Tracking Indexes (TTIs)
Our Trend Tracking Indexes (TTIs) retreated but only by a small margin.
Here’s how we closed 3/17/2017:
Domestic TTI: +2.88% (last close +3.08%)—Buy signal effective 4/4/2016
International TTI: +6.33% (last close +6.81%)—Buy signal effective 7/19/2016
Disclosure: I am obliged to inform you that I, as well as my advisory clients, own some of the ETFs listed in the above table. Furthermore, they do not represent a specific investment recommendation for you, they merely show which ETFs from the universe I track are falling within the guidelines specified.
————————————————————-
READER Q & A FOR THE WEEK
All Reader Q & A’s are listed at our web site!
Check it out at:
https://theetfbully.com/questions-answers/
———————————————————-
WOULD YOU LIKE TO HAVE YOUR INVESTMENTS PROFESSIONALLY MANAGED?
Do you have the time to follow our investment plans yourself? If you are a busy professional who would like to have his portfolio managed using our methodology, please contact me directly or get more details at:
https://theetfbully.com/personal-investment-management/
———————————————————
Back issues of the ETF/No Load Fund Tracker are available on the web at:
https://theetfbully.com/newsletter-archives/
Contact Ulli