
- Moving the Markets
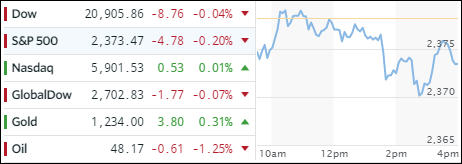
An early rebound attempt ran out of steam as the Fed paraded a couple of their mouthpieces, who managed to spew some words of hawkishness to undermine any positive market momentum. First it was Fed’s Harker, who caused some worries with announcing that we “can’t rule out more than 3 hikes this year,” which was followed by Fed’s Evans with “more upside possibility in uncertainty facing Fed,” and then this bon mot:
“This is a challenging time period to all of a sudden have a big injection of positive fiscal policy expansion because we are pretty close to full employment. We might be at full employment.”
To me, that sounded like if Trump even attempts any fiscal boost, like infrastructure spending, it may very well be met with additional rate hikes, which is not exactly soothing for the nervous crowd on Wall Street.
In the end, the pullback was minor as the major indexes recovered thanks to the usual last hour ramp thereby keeping any losses to a minimum. Retail stocks continued to get clobbered; High Yield bonds slipped again, as did the 10-year Treasuries but gold managed to hold on to its March gains.
- ETFs in the Spotlight (updated for 2017)
In case you missed the announcement and description of this section, you can read it here again.
It features 10 broadly diversified and sector ETFs from my HighVolume list as posted every Saturday. Furthermore, they are screened for the lowest MaxDD% number meaning they have been showing better resistance to temporary sell offs than all others over the past year.
The below table simply demonstrates the magnitude with which some of the ETFs are fluctuating in regards to their positions above or below their respective individual trend lines (%M/A). A break below, represented by a negative number, shows weakness, while a break above, represented by a positive percentage, shows strength.
For hundreds of ETF choices, be sure to reference Thursday’s StatSheet.
Year to date, here’s how the 2017 candidates have fared so far:
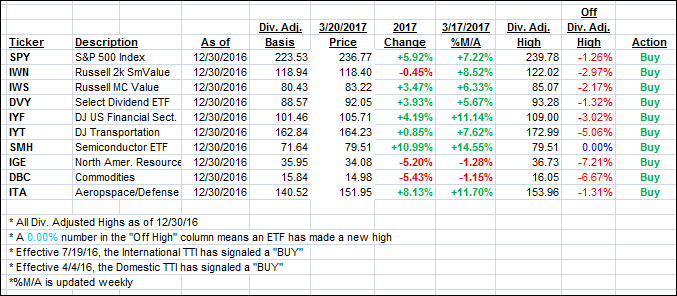
Again, the %M/A column above shows the position of the various ETFs in relation to their respective long term trend lines, while the trailing sell stops are being tracked in the “Off High” column. The “Action” column will signal a “Sell” once the -7.5% point has been taken out in the “Off High” column.
- Trend Tracking Indexes (TTIs)
Our Trend Tracking Indexes (TTIs) slipped a tad as upside market momentum was lacking.
Here’s how we closed 3/20/2017:
Domestic TTI: +2.84% (last close +2.88%)—Buy signal effective 4/4/2016
International TTI: +6.18% (last close +6.33%)—Buy signal effective 7/19/2016
Disclosure: I am obliged to inform you that I, as well as my advisory clients, own some of the ETFs listed in the above table. Furthermore, they do not represent a specific investment recommendation for you, they merely show which ETFs from the universe I track are falling within the guidelines specified.
Contact Ulli