
- Moving the Markets
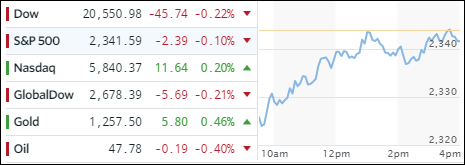
Equities looked to be on a slippery slope this morning with all indexes starting the day being underwater by about -1%. For a change, dip buyers stepped in and off to the races we went recouping almost all losses at the close. However, the Dow now has notched its 8th down day in a row, its longest losing streak since 2011. If it hits 9 tomorrow, that would be the worst spell since 1978.
Banks got clobbered again but managed to recoup some of the losses. Goldman Sachs has been on the skids 14 of the last 16 days, its worst drop since January 2016. That also means that banks have dipped into the red for the year, which not exactly a sign of confidence. Hat tip goes to ZH for these stats.
The leader continues to be the tech sector confirmed by our SMH ETF in the daily “Spotlight listings,” which has been holding on to the #1 spot for some time (see section 2 below). Energy as a whole has been lagging as oil continues on its slippery path south ending the day below $48/barrel.
The dollar dropped again and lost -0.47% for the day despite the Fed’s recent hike in interest rates. It has now erased about 80% of its post-Trump gains meaning that the “reflation theme” based on Trump’s economic projections may not play out as planned, at least not for the time being. Precious metals have been the winner of the dollar’s collapse.
- ETFs in the Spotlight (updated for 2017)
In case you missed the announcement and description of this section, you can read it here again.
It features 10 broadly diversified and sector ETFs from my HighVolume list as posted every Saturday. Furthermore, they are screened for the lowest MaxDD% number meaning they have been showing better resistance to temporary sell offs than all others over the past year.
The below table simply demonstrates the magnitude with which some of the ETFs are fluctuating in regards to their positions above or below their respective individual trend lines (%M/A). A break below, represented by a negative number, shows weakness, while a break above, represented by a positive percentage, shows strength.
For hundreds of ETF choices, be sure to reference Thursday’s StatSheet.
Year to date, here’s how the 2017 candidates have fared so far:
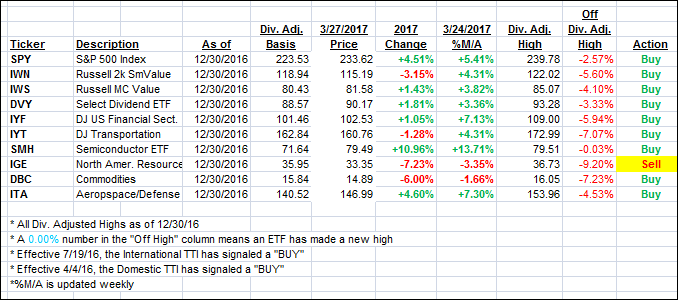
Again, the %M/A column above shows the position of the various ETFs in relation to their respective long term trend lines, while the trailing sell stops are being tracked in the “Off High” column. The “Action” column will signal a “Sell” once the -7.5% point has been taken out in the “Off High” column.
- Trend Tracking Indexes (TTIs)
Our Trend Tracking Indexes (TTIs) managed to eke out a small gain despite the major indexes ending mixed.
Here’s how we closed 3/27/2017:
Domestic TTI: +2.25% (last close +2.19%)—Buy signal effective 4/4/2016
International TTI: +5.34% (last close +5.31%)—Buy signal effective 7/19/2016
Disclosure: I am obliged to inform you that I, as well as my advisory clients, own some of the ETFs listed in the above table. Furthermore, they do not represent a specific investment recommendation for you, they merely show which ETFs from the universe I track are falling within the guidelines specified.
Contact Ulli