
- Moving the Markets
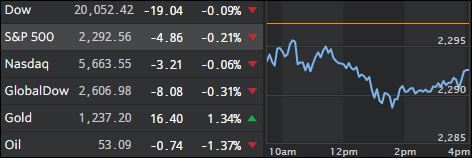
All of today’s activity happened below the unchanged line with the energy sector dropping (-0.9%) as oil prices slipped and gave back -1.37%. Of course, after Friday’s climb into record territory, a pause was in order with Wall Street awaiting the next run of earnings reports along with more clarity on Trump’s policies.
On the other hand, the post election run has been nothing but euphoric, and there has to be some realization that, despite all good intentions, Trump simply can’t get everything resolved within the first 100 days. I expect this realization, along with concerns about the backlash against protectionist policies from Washington and around the world, to cause more uncertainty in the market place.
Nine of the 11 major S&P sectors closed down along with Treasury yields while the US dollar pumped and dumped only to end the session unchanged. The winner of the day and for the year so far, was gold, which added +1.34%.
- ETFs in the Spotlight (updated for 2017)
In case you missed the announcement and description of this section, you can read it here again.
It features 10 broadly diversified and sector ETFs from my HighVolume list as posted every Saturday. Furthermore, they are screened for the lowest MaxDD% number meaning they have been showing better resistance to temporary sell offs than all others over the past year.
The below table simply demonstrates the magnitude with which some of the ETFs are fluctuating in regards to their positions above or below their respective individual trend lines (%M/A). A break below, represented by a negative number, shows weakness, while a break above, represented by a positive percentage, shows strength.
For hundreds of ETF choices, be sure to reference Thursday’s StatSheet.
Year to date, here’s how the 2017 candidates have fared so far:
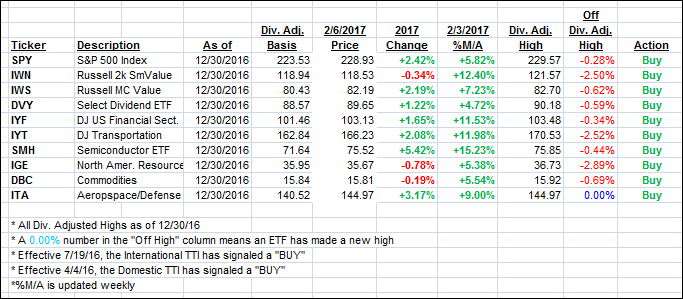
Again, the %M/A column above shows the position of the various ETFs in relation to their respective long term trend lines, while the trailing sell stops are being tracked in the “Off High” column. The “Action” column will signal a “Sell” once the -7.5% point has been taken out in the “Off High” column.
- Trend Tracking Indexes (TTIs)
Our Trend Tracking Indexes (TTIs) corrected a fraction as the major indexes pulled back a tad.
Here’s how we closed 2/6/2017:
Domestic TTI: +2.00% (last close +2.04%)—Buy signal effective 4/4/2016
International TTI: +4.64% (last close +4.99%)—Buy signal effective 7/19/2016
Disclosure: I am obliged to inform you that I, as well as my advisory clients, own some of the ETFs listed in the above table. Furthermore, they do not represent a specific investment recommendation for you, they merely show which ETFs from the universe I track are falling within the guidelines specified.
Contact Ulli