
- Moving the Markets
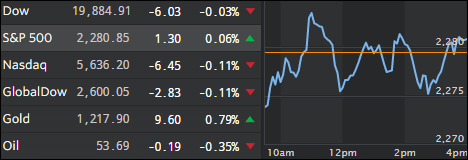
“Dead man walking” would best describe today’s session as the major indexes continued their recent sideways pattern by vacillating above and below their respective trend lines with nothing to show for at the end. It’s been now 78 days since the S&P 500 moved 1%, which simply tells us how narrow this trading channel has been.
Bonds went nowhere with the 1-year Treasury yield barely budging and even the always lurking and potentially trend affecting VIX was flat. Oil dropped a slight -0.35%, but the winner was gold, which gained 0.79%.
On deck is tomorrow’s jobs report, which could move the markets in either direction, although I think it will take a back seat to the latest announcements from the White House in regards to the potential protectionist and populist sentiment.
- ETFs in the Spotlight (updated for 2017)
In case you missed the announcement and description of this section, you can read it here again.
It features 10 broadly diversified and sector ETFs from my HighVolume list as posted every Saturday. Furthermore, they are screened for the lowest MaxDD% number meaning they have been showing better resistance to temporary sell offs than all others over the past year.
The below table simply demonstrates the magnitude with which some of the ETFs are fluctuating in regards to their positions above or below their respective individual trend lines (%M/A). A break below, represented by a negative number, shows weakness, while a break above, represented by a positive percentage, shows strength.
For hundreds of ETF choices, be sure to reference Thursday’s StatSheet.
Year to date, here’s how the 2017 candidates have fared so far:
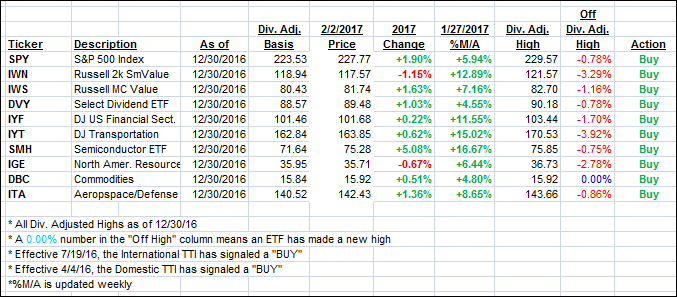
Again, the %M/A column above shows the position of the various ETFs in relation to their respective long term trend lines, while the trailing sell stops are being tracked in the “Off High” column. The “Action” column will signal a “Sell” once the -7.5% point has been taken out in the “Off High” column.
- Trend Tracking Indexes (TTIs)
Our Trend Tracking Indexes (TTIs) showed a repeat performance from yesterday by hardly moving as stocks appear to be stuck in a sideways pattern.
Here’s how we closed 2/2/2017:
Domestic TTI: +1.84% (last close +1.83%)—Buy signal effective 4/4/2016
International TTI: +4.63% (last close +4.74%)—Buy signal effective 7/19/2016
Disclosure: I am obliged to inform you that I, as well as my advisory clients, own some of the ETFs listed in the above table. Furthermore, they do not represent a specific investment recommendation for you, they merely show which ETFs from the universe I track are falling within the guidelines specified.
Contact Ulli