
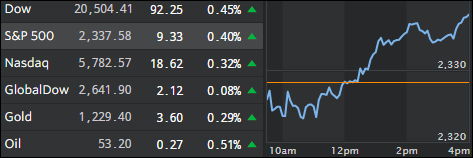
- Moving the Markets
All eyes were on the Fed today, or more specifically Janet Yellen’s testimony before the U.S. senate banking committee. Among much jawboning Yellen warned that “waiting too long to remove accommodation would be unwise,” along with this bon mot that “at our upcoming meetings, the committee will evaluate whether employment and inflation are continuing to evolve in line with these expectations, in which case a further adjustment of the federal funds rate would likely be appropriate.” Isn’t the latter what they evaluate at every meeting?
As always, Yellen left the door wide open if three interest rate hikes would be warranted this year as they originally signaled last December. In other words, the direction of interest rates is as murky as ever. Nevertheless, the markets interpreted her speech as being hawkish (higher rates) and yields surged with the 10-year yield gaining 4 basis points to +2.47%. As a result, the widely held 20-year Treasury Bond ETF (TLT) lost -0.72%.
With higher rates, you would have expected equities to tank—but no—the rally continued with all major indexes gaining as the above table shows. Bank stocks and the dollar headed higher along with gold, which gained marginally. Right now, so it seems, we’re back to where any news is good news for stocks…
- ETFs in the Spotlight (updated for 2017)
In case you missed the announcement and description of this section, you can read it here again.
It features 10 broadly diversified and sector ETFs from my HighVolume list as posted every Saturday. Furthermore, they are screened for the lowest MaxDD% number meaning they have been showing better resistance to temporary sell offs than all others over the past year.
The below table simply demonstrates the magnitude with which some of the ETFs are fluctuating in regards to their positions above or below their respective individual trend lines (%M/A). A break below, represented by a negative number, shows weakness, while a break above, represented by a positive percentage, shows strength.
For hundreds of ETF choices, be sure to reference Thursday’s StatSheet.
Year to date, here’s how the 2017 candidates have fared so far:
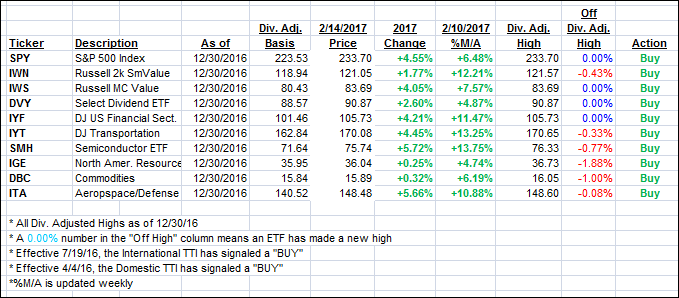
Again, the %M/A column above shows the position of the various ETFs in relation to their respective long term trend lines, while the trailing sell stops are being tracked in the “Off High” column. The “Action” column will signal a “Sell” once the -7.5% point has been taken out in the “Off High” column.
- Trend Tracking Indexes (TTIs)
Our Trend Tracking Indexes (TTIs) edged higher as potential interest rate hikes by the Fed were now interpreted as a positive—at least for the time being.
Here’s how we closed 2/14/2017:
Domestic TTI: +2.61% (last close +2.56%)—Buy signal effective 4/4/2016
International TTI: +5.16% (last close +5.13%)—Buy signal effective 7/19/2016
Disclosure: I am obliged to inform you that I, as well as my advisory clients, own some of the ETFs listed in the above table. Furthermore, they do not represent a specific investment recommendation for you, they merely show which ETFs from the universe I track are falling within the guidelines specified.
Contact Ulli