
- Moving the Markets
The stagnated rally of the past few days, during which Wall Street was looking for more details about Trump’s agenda, was revived today when he stepped up to the plate and said that “he would make a major tax announcement in a few weeks.” He also added that “lowering the overall tax burden on American business is big league” without giving any further indication as to what this might entail.
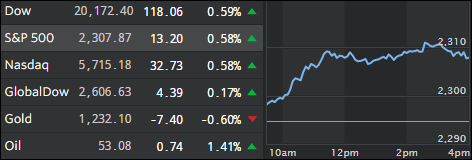
That’s all it took, and the major indexes scored a triple with all three of them gaining over +0.5% for the session. Financials performed the best by gaining +1.4% and were closely followed by energy with +0.9%, while the conservative utilities sector gave back -0.8%.
Trump’s announcement overrode even poor earnings news from Twitter (-12.3%), Intel (-2.5%) and Coca Cola (-1.8%). Bonds sold off as interest rates rose with the US-10 year yield gaining 6 basis points to 2.40%, as the 30-year bond yield spiked back above the 3% level to end at 3.02%.
- ETFs in the Spotlight (updated for 2017)
In case you missed the announcement and description of this section, you can read it here again.
It features 10 broadly diversified and sector ETFs from my HighVolume list as posted every Saturday. Furthermore, they are screened for the lowest MaxDD% number meaning they have been showing better resistance to temporary sell offs than all others over the past year.
The below table simply demonstrates the magnitude with which some of the ETFs are fluctuating in regards to their positions above or below their respective individual trend lines (%M/A). A break below, represented by a negative number, shows weakness, while a break above, represented by a positive percentage, shows strength.
For hundreds of ETF choices, be sure to reference Thursday’s StatSheet.
Year to date, here’s how the 2017 candidates have fared so far:
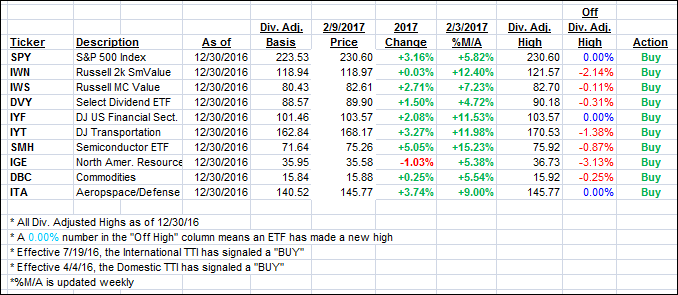
Again, the %M/A column above shows the position of the various ETFs in relation to their respective long term trend lines, while the trailing sell stops are being tracked in the “Off High” column. The “Action” column will signal a “Sell” once the -7.5% point has been taken out in the “Off High” column.
- Trend Tracking Indexes (TTIs)
Our Trend Tracking Indexes (TTIs) followed the major indexes higher as Trump’s use of the “T” word created new buying enthusiasm.
Here’s how we closed 2/9/2017:
Domestic TTI: +2.39% (last close +2.13%)—Buy signal effective 4/4/2016
International TTI: +4.73% (last close +4.42%)—Buy signal effective 7/19/2016
Disclosure: I am obliged to inform you that I, as well as my advisory clients, own some of the ETFs listed in the above table. Furthermore, they do not represent a specific investment recommendation for you, they merely show which ETFs from the universe I track are falling within the guidelines specified.
Contact Ulli