
- Moving the Markets
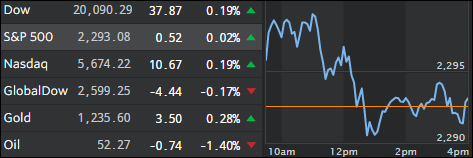
An early euphoric bounce, which pushed the Dow and Nasdaq to new intra-day highs faded and then took a nose-dive below the unchanged line before recovering slightly into the close. The morning strength was caused by the US dollar rallying sharply as hawkish comments from one of the Fed’s mouthpieces indicated that “March was live” and three rate hikes were still on the table.
I am not sure how much of that was empty jawboning but the dollar rally reversed later on leaving the gain at a more modest +0.50%. Treasury bonds rallied with TLT gaining +0.74% for the day. Adding to the confusion are the upcoming (March) debt ceiling talks, the outcome of which will for sure have an impact on just about all asset classes.
The weakling of the day was Crude Oil, which not only lost -1.40% but also broke below its 50 DMA (Daily Moving Average) which, after having served as a springboard for weeks, has now become a ceiling and could spell more weakness for the sector. On the other end of the spectrum was gold, which broke above its 100 DMA by gaining another +0.28% and has now risen 7 out of the last 8 days.
- ETFs in the Spotlight (updated for 2017)
In case you missed the announcement and description of this section, you can read it here again.
It features 10 broadly diversified and sector ETFs from my HighVolume list as posted every Saturday. Furthermore, they are screened for the lowest MaxDD% number meaning they have been showing better resistance to temporary sell offs than all others over the past year.
The below table simply demonstrates the magnitude with which some of the ETFs are fluctuating in regards to their positions above or below their respective individual trend lines (%M/A). A break below, represented by a negative number, shows weakness, while a break above, represented by a positive percentage, shows strength.
For hundreds of ETF choices, be sure to reference Thursday’s StatSheet.
Year to date, here’s how the 2017 candidates have fared so far:
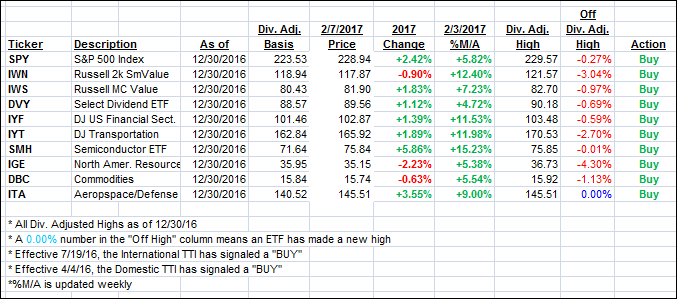
Again, the %M/A column above shows the position of the various ETFs in relation to their respective long term trend lines, while the trailing sell stops are being tracked in the “Off High” column. The “Action” column will signal a “Sell” once the -7.5% point has been taken out in the “Off High” column.
- Trend Tracking Indexes (TTIs)
Our Trend Tracking Indexes (TTIs) were mixed with the Domestic one gaining a tad while the International one pulled back.
Here’s how we closed 2/7/2017:
Domestic TTI: +2.08% (last close +2.00%)—Buy signal effective 4/4/2016
International TTI: +4.41% (last close +4.64%)—Buy signal effective 7/19/2016
Disclosure: I am obliged to inform you that I, as well as my advisory clients, own some of the ETFs listed in the above table. Furthermore, they do not represent a specific investment recommendation for you, they merely show which ETFs from the universe I track are falling within the guidelines specified.
Contact Ulli