
- Moving the Markets
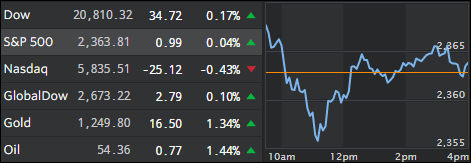
Thursday turned into a whip-saw kind of a day with the three major indexes vacillating above and below their respective unchanged lines but, in the end, the algos managed to push 2 out of 3 back into positive territory. Only the Nasdaq closed in the red, predominantly caused by weakness in Tesla.
Contributing to the uncertainty were statements by Treasury Secretary Mnuchin trying to throw some reality in this perceived economic nirvana that more details on the promised tax reform are not yet available. More importantly, he caught many of guard with his view that “new policies will have at best a limited impact in 2017,” and that he “doesn’t expect to see growth until 2018,” which are facts that I commented on two days ago. We will now have to wait and see if this disappointment carries over into the markets.
In summary, ZeroHedge explained it best: The market may soon pull a Wile E. Coyote—having scrambled too far, too fast, only to find itself suddenly with no firm ground below it, and the realization that any hope for a Trump tax plan to validate the recent move, will not be forthcoming for a long time.
- ETFs in the Spotlight (updated for 2017)
In case you missed the announcement and description of this section, you can read it here again.
It features 10 broadly diversified and sector ETFs from my HighVolume list as posted every Saturday. Furthermore, they are screened for the lowest MaxDD% number meaning they have been showing better resistance to temporary sell offs than all others over the past year.
The below table simply demonstrates the magnitude with which some of the ETFs are fluctuating in regards to their positions above or below their respective individual trend lines (%M/A). A break below, represented by a negative number, shows weakness, while a break above, represented by a positive percentage, shows strength.
For hundreds of ETF choices, be sure to reference Thursday’s StatSheet.
Year to date, here’s how the 2017 candidates have fared so far:
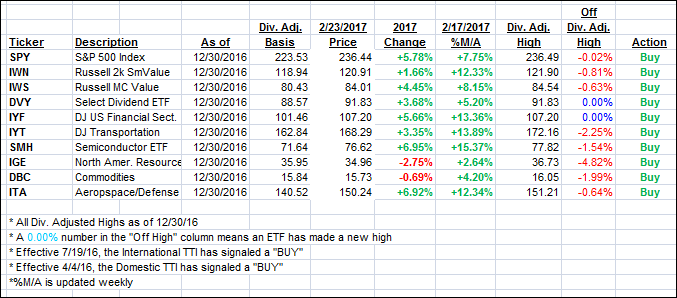
Again, the %M/A column above shows the position of the various ETFs in relation to their respective long term trend lines, while the trailing sell stops are being tracked in the “Off High” column. The “Action” column will signal a “Sell” once the -7.5% point has been taken out in the “Off High” column.
- Trend Tracking Indexes (TTIs)
Our Trend Tracking Indexes (TTIs) barely changed as the major indexes whip-sawed.
Here’s how we closed 2/23/2017:
Domestic TTI: +2.97% (last close +2.97%)—Buy signal effective 4/4/2016
International TTI: +5.74% (last close +5.71%)—Buy signal effective 7/19/2016
Disclosure: I am obliged to inform you that I, as well as my advisory clients, own some of the ETFs listed in the above table. Furthermore, they do not represent a specific investment recommendation for you, they merely show which ETFs from the universe I track are falling within the guidelines specified.
Contact Ulli