
- Moving the Markets
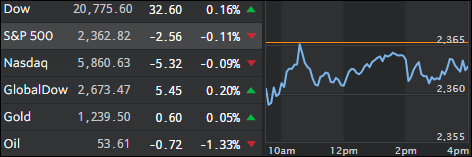
To much shock and surprise all three major indexes opened down this morning—by a gigantic -0.3%. Since in this new normal, a larger downside margin is no longer allowed, so a rebound materialized and up we went, but only the Dow managed to close in the green. Of course, I am being facetious here, but that seems to be the mode of operation of the past year or so in that the downside is “protected” and only unlimited upside moves, warranted or not, are permitted.
The Dow managed to add another record close; it’s 9th in a row, which made it its longest streak since 1987. The index index is now 2,000 points above its 200-day moving average, which is quite a large margin and begs the question as to when the overdue correction will finally occur. On the other hand, that spread is less than 10%, which is below the 12-14% historically critical level that marks a statistically overbought market. That means, theoretically, there is more room to run…
The Fed stepped on the breaks again after the minutes indicated that “it may be appropriate to raise interest rates again ‘fairly soon,’ depending on jobs and inflation data.” Translated, it means that, even after Yellen’s recent hawkish statements, a rate hike in March maybe not be forthcoming after all. Go figure…
- ETFs in the Spotlight (updated for 2017)
In case you missed the announcement and description of this section, you can read it here again.
It features 10 broadly diversified and sector ETFs from my HighVolume list as posted every Saturday. Furthermore, they are screened for the lowest MaxDD% number meaning they have been showing better resistance to temporary sell offs than all others over the past year.
The below table simply demonstrates the magnitude with which some of the ETFs are fluctuating in regards to their positions above or below their respective individual trend lines (%M/A). A break below, represented by a negative number, shows weakness, while a break above, represented by a positive percentage, shows strength.
For hundreds of ETF choices, be sure to reference Thursday’s StatSheet.
Year to date, here’s how the 2017 candidates have fared so far:
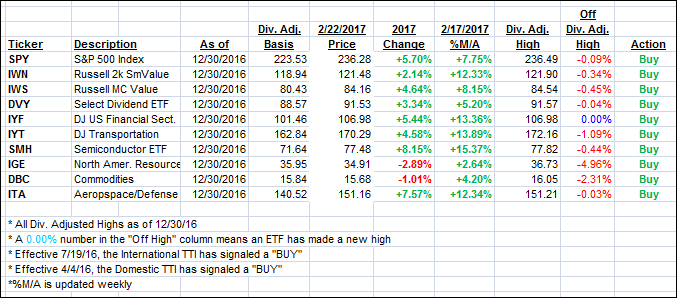
Again, the %M/A column above shows the position of the various ETFs in relation to their respective long term trend lines, while the trailing sell stops are being tracked in the “Off High” column. The “Action” column will signal a “Sell” once the -7.5% point has been taken out in the “Off High” column.
- Trend Tracking Indexes (TTIs)
Our Trend Tracking Indexes (TTIs) slipped a tad as market momentum was predominantly sideways.
Here’s how we closed 2/22/2017:
Domestic TTI: +2.97% (last close +3.01%)—Buy signal effective 4/4/2016
International TTI: +5.71% (last close +5.73%)—Buy signal effective 7/19/2016
Disclosure: I am obliged to inform you that I, as well as my advisory clients, own some of the ETFs listed in the above table. Furthermore, they do not represent a specific investment recommendation for you, they merely show which ETFs from the universe I track are falling within the guidelines specified.
Contact Ulli