
- Moving the Markets
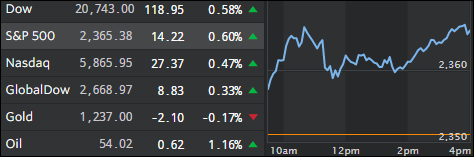
Last week’s record setting pace continued today as all three major indexes powered higher led by the S&P 500 with a gain of +0.60%. The fact that concerns remain about excessive valuation did not matter; in the end all of the S&P’s 11 sectors closed up with even defensive areas like real estate, utilities and consumer staples joining the party.
In regards to valuations, Reuters writes that the S&P is trading at 17.8 times estimated earnings for the next 12 months, which is above the long-term average of 15 times. That means that there is no doubt that the market is overextended and is overdue for a pullback, especially in view of the fact that we have now gone 50 days in a row without a 1% move.
So, what might derail this rally? Absent of a whole slew of external global events, I believe that Trump’s agenda, as well meaning as it is, may not be able to be implemented within the time frame the market expects. While his recent announcement in regards to major tax cuts, due out soon, has accelerated upward momentum, no details have emerged yet, so all is based on hype and hope. If he delivers as expected, we may see this run continue for a while, however, if he falls short of these heightened expectations, bearish forces may come into play again.
- ETFs in the Spotlight (updated for 2017)
In case you missed the announcement and description of this section, you can read it here again.
It features 10 broadly diversified and sector ETFs from my HighVolume list as posted every Saturday. Furthermore, they are screened for the lowest MaxDD% number meaning they have been showing better resistance to temporary sell offs than all others over the past year.
The below table simply demonstrates the magnitude with which some of the ETFs are fluctuating in regards to their positions above or below their respective individual trend lines (%M/A). A break below, represented by a negative number, shows weakness, while a break above, represented by a positive percentage, shows strength.
For hundreds of ETF choices, be sure to reference Thursday’s StatSheet.
Year to date, here’s how the 2017 candidates have fared so far:
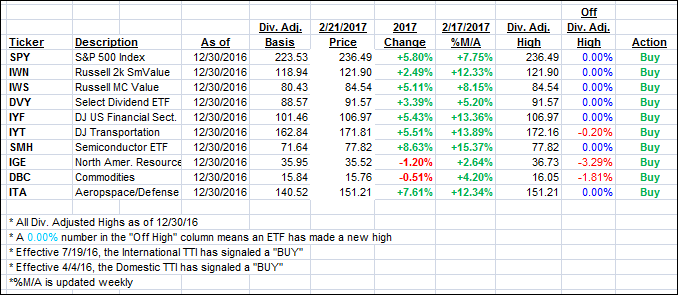
Again, the %M/A column above shows the position of the various ETFs in relation to their respective long term trend lines, while the trailing sell stops are being tracked in the “Off High” column. The “Action” column will signal a “Sell” once the -7.5% point has been taken out in the “Off High” column.
- Trend Tracking Indexes (TTIs)
Our Trend Tracking Indexes (TTIs) headed north as last week’s rally continued without skipping a beat.
Here’s how we closed 2/21/2017:
Domestic TTI: +3.01% (last close +2.81%)—Buy signal effective 4/4/2016
International TTI: +5.73% (last close +5.34%)—Buy signal effective 7/19/2016
Disclosure: I am obliged to inform you that I, as well as my advisory clients, own some of the ETFs listed in the above table. Furthermore, they do not represent a specific investment recommendation for you, they merely show which ETFs from the universe I track are falling within the guidelines specified.
Contact Ulli