
- Moving the Markets
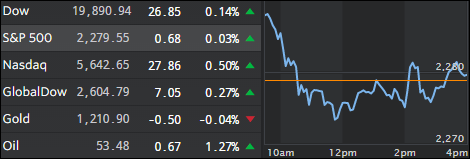
An early rally fizzled in a hurry as the Dow and S&P 500 dipped into negative territory but managed to crawl back to barely conquer the unchanged line. The Nasdaq ended solidly in the green by +0.50% thanks to gains in Apple shares, which rallied 6.1% to $128.75 and reached its highest close in 18 months.
The Fed was up next and while they did not change interest rates, as expected, their accompanying language lacked detail as to when the next rate hike might be forthcoming. Remember, back in December 2016, it appeared that 3 hikes during 2017 seemed like a foregone conclusion.
Wall Street hates uncertainty, which was reflected in today’s session and which resembled predominantly aimless meandering as stocks struggled to find momentum. The dollar took a dive after the Fed’s decision but ended relatively unchanged while Treasury yields rose.
Chaos happened in the energy complex as computer algos got stuck in a tug-of-war with oil selling off, ramping up sharply thereafter, crashing again to the lows but rallying into the close on a weak dollar. Surely, with that much idiocy, traders in that complex have to be sporting a head of gray hairs.
- ETFs in the Spotlight (updated for 2017)
In case you missed the announcement and description of this section, you can read it here again.
It features 10 broadly diversified and sector ETFs from my HighVolume list as posted every Saturday. Furthermore, they are screened for the lowest MaxDD% number meaning they have been showing better resistance to temporary sell offs than all others over the past year.
The below table simply demonstrates the magnitude with which some of the ETFs are fluctuating in regards to their positions above or below their respective individual trend lines (%M/A). A break below, represented by a negative number, shows weakness, while a break above, represented by a positive percentage, shows strength.
For hundreds of ETF choices, be sure to reference Thursday’s StatSheet.
Year to date, here’s how the 2017 candidates have fared so far:
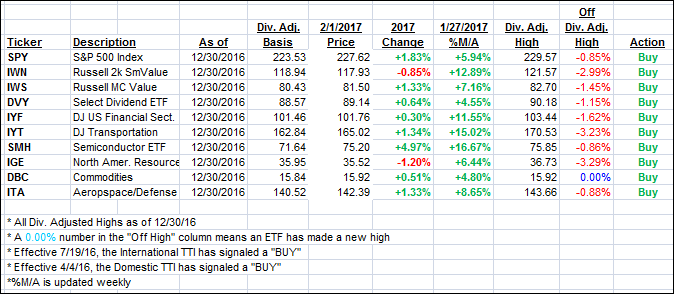
Again, the %M/A column above shows the position of the various ETFs in relation to their respective long term trend lines, while the trailing sell stops are being tracked in the “Off High” column. The “Action” column will signal a “Sell” once the -7.5% point has been taken out in the “Off High” column.
- Trend Tracking Indexes (TTIs)
Our Trend Tracking Indexes (TTIs) again edged higher by a fraction of a percent as market direction was predominantly sideways.
Here’s how we closed 2/1/2017:
Domestic TTI: +1.83% (last close +1.78%)—Buy signal effective 4/4/2016
International TTI: +4.74% (last close +4.53%)—Buy signal effective 7/19/2016
Disclosure: I am obliged to inform you that I, as well as my advisory clients, own some of the ETFs listed in the above table. Furthermore, they do not represent a specific investment recommendation for you, they merely show which ETFs from the universe I track are falling within the guidelines specified.
Contact Ulli