
- Moving the Markets
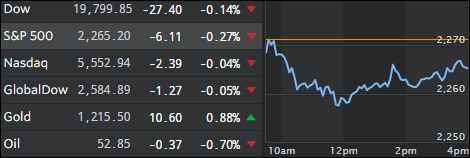
While equities started the day on a negative note, they did improve throughout the session and ended only fractionally lower. The post-election rally hit another snag as Trump’s protectionist stance on trade did nothing to soothe the bullish crowd on Wall Street.
First, Trump signed paperwork to formally withdraw the US from the widely criticized and secretive Trans Pacific Partnership (TPP) trade pact. Second, he confirmed his intentions to renegotiate NAFTA, the North American Free Trade Agreement. All this adds up to change and uncertainty, which are two words that are likely the most hated ones on Wall Street.
The energy sector was pressured again, as crude oil pulled back from a recent rally. Interest rates were lower while the US dollar fell again giving a continued boost to precious metals. For better or for worse, Trump’s agenda is in full swing, and we will have to wait and see how things play out in regards to the continuation of the current bull market. More clarity is needed to see which way the pendulum between bulls and bears will swing.
- ETFs in the Spotlight (updated for 2017)
In case you missed the announcement and description of this section, you can read it here again.
It features 10 broadly diversified and sector ETFs from my HighVolume list as posted every Saturday. Furthermore, they are screened for the lowest MaxDD% number meaning they have been showing better resistance to temporary sell offs than all others over the past year.
The below table simply demonstrates the magnitude with which some of the ETFs are fluctuating in regards to their positions above or below their respective individual trend lines (%M/A). A break below, represented by a negative number, shows weakness, while a break above, represented by a positive percentage, shows strength.
For hundreds of ETF choices, be sure to reference Thursday’s StatSheet.
Year to date, here’s how the 2017 candidates have fared so far:
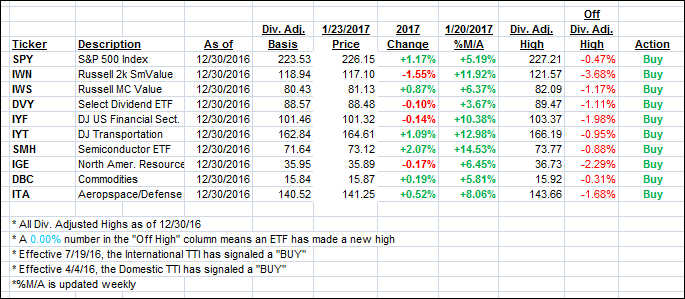
Again, the %M/A column above shows the position of the various ETFs in relation to their respective long term trend lines, while the trailing sell stops are being tracked in the “Off High” column. The “Action” column will signal a “Sell” once the -7.5% point has been taken out in the “Off High” column.
- Trend Tracking Indexes (TTIs)
Our Trend Tracking Indexes (TTIs) crawled higher despite the major indexes slipping.
Here’s how we closed 1/23/2017:
Domestic TTI: +1.49% (last close +1.40%)—Buy signal effective 4/4/2016
International TTI: +4.12% (last close +4.07%)—Buy signal effective 7/19/2016
Disclosure: I am obliged to inform you that I, as well as my advisory clients, own some of the ETFs listed in the above table. Furthermore, they do not represent a specific investment recommendation for you, they merely show which ETFs from the universe I track are falling within the guidelines specified.
Contact Ulli