
- Moving the Markets
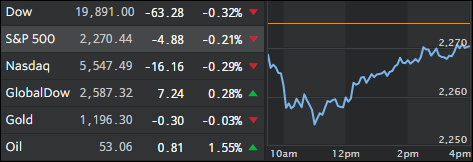
Things started out to the downside with the S&P 500 sliding almost 1% after Wall Street had some time to digest President-elect Trump’s press conference. Disappointment spread as he chose not to discuss details of his proposed economic policies that were the main driver behind the post-election rally. However, the indexes were magically lifted later on in the session saving equities from their worst day in 3 months.
This brings into question as to whether Trump can actually push his agenda through in a timely manner. If not, there is a high probability that market volatility will increase and with it the possibility of equities giving back some of their gains. After all, markets are in bubble territory when viewed based on economic fundamentals; however, they can stay in the mode until, one day, wishful thinking along with hope give way to reality. Historically, it always does, however, the timing of it is the big unknown.
In economic news, Fiat/Chrysler’s stock price crashed over 14% and trading was halted. The old cockroach theory was verified: If you see one, there are others in hiding. Turns out that Fiat has been accused of engaging in a similar scheme as Volkswagen by using cheating software to beat diesel emissions tests. Makes me wonder who is on deck next.
- ETFs in the Spotlight (updated for 2017)
In case you missed the announcement and description of this section, you can read it here again.
It features 10 broadly diversified and sector ETFs from my HighVolume list as posted every Saturday. Furthermore, they are screened for the lowest MaxDD% number meaning they have been showing better resistance to temporary sell offs than all others over the past year.
The below table simply demonstrates the magnitude with which some of the ETFs are fluctuating in regards to their positions above or below their respective individual trend lines (%M/A). A break below, represented by a negative number, shows weakness, while a break above, represented by a positive percentage, shows strength.
For hundreds of ETF choices, be sure to reference Thursday’s StatSheet.
Year to date, here’s how the 2017 candidates have fared so far:
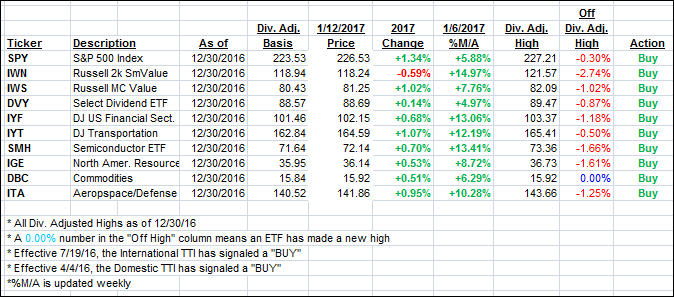
Again, the %M/A column above shows the position of the various ETFs in relation to their respective long term trend lines, while the trailing sell stops are being tracked in the “Off High” column. The “Action” column will signal a “Sell” once the -7.5% point has been taken out in the “Off High” column.
- Trend Tracking Indexes (TTIs)
Our Trend Tracking Indexes (TTIs) were mixed with the Domestic one slipping while the International one inched up a tad.
Here’s how we closed 1/12/2017:
Domestic TTI: +1.63% (last close +1.71%)—Buy signal effective 4/4/2016
International TTI: +4.07% (last close +3.97%)—Buy signal effective 7/19/2016
Disclosure: I am obliged to inform you that I, as well as my advisory clients, own some of the ETFs listed in the above table. Furthermore, they do not represent a specific investment recommendation for you, they merely show which ETFs from the universe I track are falling within the guidelines specified.
Contact Ulli