
- Moving the Markets
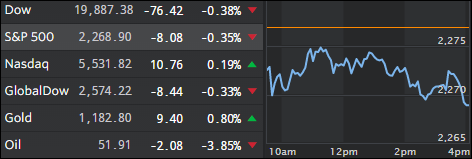
At least for today, New Year momentum slowed as the major indexes predominantly hovered below the unchanged line and closed at their lows for the session. The exception was the Nasdaq, which managed to eke out a gain of +0.19%.
It was a tale of opposing market forces as technology strength was offset by weakness in financials and the energy sector. Oil took a beating and lost -3.85%. Bonds pulled back as Treasury yields rose slightly. The dollar came off its lofty level and, as a result, gold was the winner by adding +0.80%.
It seems right now we are in a holding pattern with earnings on deck as Wall Street is dealing with the political uncertainty as to whether Trump will be able to deliver on tax cuts, lighter regulation and fiscal stimulus.
- ETFs in the Spotlight (updated for 2017)
In case you missed the announcement and description of this section, you can read it here again.
It features 10 broadly diversified and sector ETFs from my HighVolume list as posted every Saturday. Furthermore, they are screened for the lowest MaxDD% number meaning they have been showing better resistance to temporary sell offs than all others over the past year.
The below table simply demonstrates the magnitude with which some of the ETFs are fluctuating in regards to their positions above or below their respective individual trend lines (%M/A). A break below, represented by a negative number, shows weakness, while a break above, represented by a positive percentage, shows strength.
For hundreds of ETF choices, be sure to reference Thursday’s StatSheet.
Year to date, here’s how the 2017 candidates have fared so far:
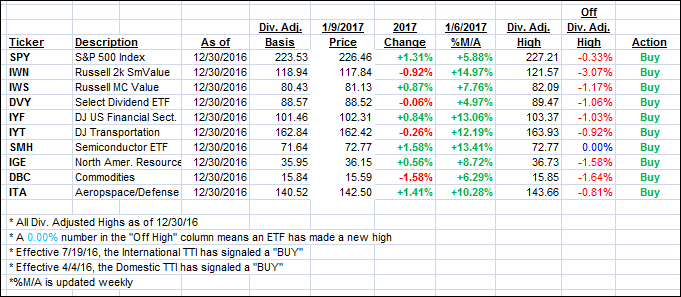
Again, the %M/A column above shows the position of the various ETFs in relation to their respective long term trend lines, while the trailing sell stops are being tracked in the “Off High” column. The “Action” column will signal a “Sell” once the -7.5% point has been taken out in the “Off High” column.
- Trend Tracking Indexes (TTIs)
Our Trend Tracking Indexes (TTIs) pulled back a tad as 2 of the 3 major indexes were stuck below the unchanged line.
Here’s how we closed 1/9/2017:
Domestic TTI: +1.53% (last close +1.60%)—Buy signal effective 4/4/2016
International TTI: +3.48% (last close +3.51%)—Buy signal effective 7/19/2016
Disclosure: I am obliged to inform you that I, as well as my advisory clients, own some of the ETFs listed in the above table. Furthermore, they do not represent a specific investment recommendation for you, they merely show which ETFs from the universe I track are falling within the guidelines specified.
Contact Ulli