
- Moving the Markets
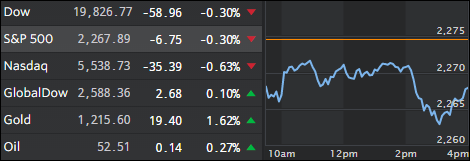
Uncertainty gripped the markets as remarks from President-elect Trump about the dollar being too strong pulled the starch out of any upside momentum, and the major indexes spent the session below their unchanged lines with the S&P 500 losing a modest -0.30%.
Not helping equities were remarks from U.K. Prime Minister May detailing Brexit plans, which sparked a huge rally in the British Pound. As the Dollar weakened, interest rates pulled back with the 20+ year T-Bond ETF (TLT) rallying +1.05%, which in turn put pressure on the Financials (IYF), which dropped -1.55% for the day. Even better-than-expected quarterly earnings from Morgan Stanley (MS) could not stem the slide.
The clear winner of the day was gold, which gained $19.40, or 1.62%, breaking back above the $1,200 level. This post-election equity rally was in part based on the surging dollar, which moved very much in sync with the S&P 500. And then this happened:
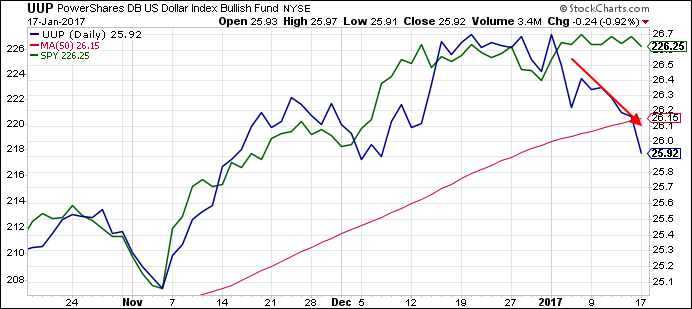
It clearly shows how the bullish dollar (UUP) has been leading the S&P 500 (SPY) ever since election time. However, recently a problem has emerged as UUP has weakened leaving the possibility wide open that the SPY could follow this newly established downtrend. Since no one has that answer, we will have to wait and see if this actually materializes or if the dollar heads back north again.
- ETFs in the Spotlight (updated for 2017)
In case you missed the announcement and description of this section, you can read it here again.
It features 10 broadly diversified and sector ETFs from my HighVolume list as posted every Saturday. Furthermore, they are screened for the lowest MaxDD% number meaning they have been showing better resistance to temporary sell offs than all others over the past year.
The below table simply demonstrates the magnitude with which some of the ETFs are fluctuating in regards to their positions above or below their respective individual trend lines (%M/A). A break below, represented by a negative number, shows weakness, while a break above, represented by a positive percentage, shows strength.
For hundreds of ETF choices, be sure to reference Thursday’s StatSheet.
Year to date, here’s how the 2017 candidates have fared so far:
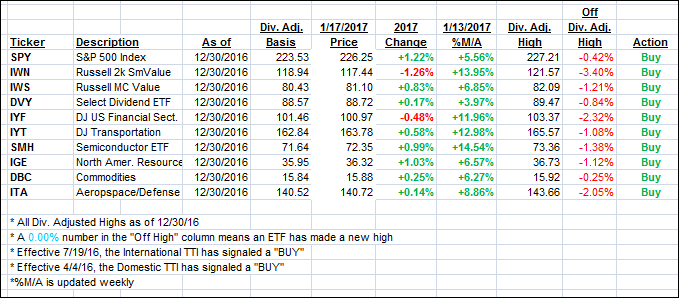
Again, the %M/A column above shows the position of the various ETFs in relation to their respective long term trend lines, while the trailing sell stops are being tracked in the “Off High” column. The “Action” column will signal a “Sell” once the -7.5% point has been taken out in the “Off High” column.
- Trend Tracking Indexes (TTIs)
Our Trend Tracking Indexes (TTIs) retreated as the markets did not manage to gain any traction.
Here’s how we closed 1/17/2017:
Domestic TTI: +1.55% (last Friday +1.66%)—Buy signal effective 4/4/2016
International TTI: +4.07% (last Friday +4.36%)—Buy signal effective 7/19/2016
Disclosure: I am obliged to inform you that I, as well as my advisory clients, own some of the ETFs listed in the above table. Furthermore, they do not represent a specific investment recommendation for you, they merely show which ETFs from the universe I track are falling within the guidelines specified.
Contact Ulli