
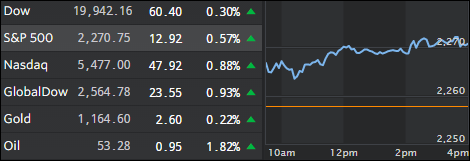
- Moving the Markets
The Fed minutes of their December meeting were the most anticipated event of the day. They revealed concerns that accelerating economic growth under Trump’s stimulus plan might require faster interest rate hikes to get a handle on the accompanying inflation. This is about as hawkish of a statement the Fed has released in the past 2 years.
The markets took it as a positive for the time being based on the hope that as long as GDP grows proportionately, the inflation scenario should be manageable, or so the theory goes.
On the other hand, it was extremely low interest rates, along with the Fed’s promise to keep them that way, and not economic fundamentals, which fueled the rally since the 2008 financial crisis. But now, it’s supposed to be the opposite. We’ll find out how that is going to work…
On the economic side, we learned that the “Refi-Boom” has crashed to lows not seen since late 2008. Down over 60% since August, the re-fi index crashed over 22% over the Christmas/New Year period.
Another crash happened after hours and this one in stock prices for Macy’s and Kohl’s. Slashing their full-year forecast, adjusting EPS down along with sales and laying off thousands is a downer for retail, which confirms what I have been posting about before, namely that the economy and the stock market are totally disconnected. The question in my mind is “who’s next in admitting poor retail data and at what point will equities be affected?”
- ETFs in the Spotlight (updated for 2017)
In case you missed the announcement and description of this section, you can read it here again.
It features 10 broadly diversified and sector ETFs from my HighVolume list as posted every Saturday. Furthermore, they are screened for the lowest MaxDD% number meaning they have been showing better resistance to temporary sell offs than all others over the past year.
The below table simply demonstrates the magnitude with which some of the ETFs are fluctuating in regards to their positions above or below their respective individual trend lines (%M/A). A break below, represented by a negative number, shows weakness, while a break above, represented by a positive percentage, shows strength.
For hundreds of ETF choices, be sure to reference Thursday’s StatSheet.
Year to date, here’s how the 2017 candidates have fared so far:
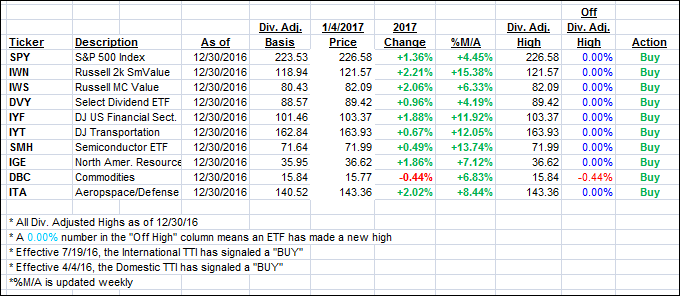
Again, the %M/A column above shows the position of the various ETFs in relation to their respective long term trend lines, while the trailing sell stops are being tracked in the “Off High” column. The “Action” column will signal a “Sell” once the -7.5% point has been taken out in the “Off High” column.
- Trend Tracking Indexes (TTIs)
Our Trend Tracking Indexes (TTIs) headed north supported by continued upside momentum.
Here’s how we closed 1/4/2017:
Domestic TTI: +1.45% (last close +1.12%)—Buy signal effective 4/4/2016
International TTI: +2.57% (last close +1.92%)—Buy signal effective 7/19/2016
Disclosure: I am obliged to inform you that I, as well as my advisory clients, own some of the ETFs listed in the above table. Furthermore, they do not represent a specific investment recommendation for you, they merely show which ETFs from the universe I track are falling within the guidelines specified.
Contact Ulli