
- Moving the Markets
Keeping the major indexes in check was a report showing that US economic growth slowed in the 4th quarter expanding 1.6% for all of 2016, its worst performance since 2011. Sure, there were periods of stronger growth, such as in the third quarter, which clocked in at a 3.5% annual rate but, in the end, 2016 turned out to anemic. We now have to see if Trump’s campaign promise of delivering a solid 4% based on cutting taxes, reducing regulation and increasing infrastructure spending will actually come to fruition.
Here’s Deutsche Bank with some more details:
It appears that Deutsche Bank’s warning that the global economy is about to roll over was spot on, because moments ago the Bureau of Economic Analysis reported that GDP in Q4 rose only 1.9%, barely above the lowest forecast of 1.7%, and below both the consensus estimate of 2.2% and the whisper estimate of 2.5%-2.6%. The reason for the big miss, and nearly 50% drop from the 3.5% print in Q3: a collapse in contribution to GDP from trade (net exports and imports) which subtracted a whopping 1.7% from the headline number. So much for that soybean bumper boost to the US economy. The silver lining: Business investment picked up to 0.67% of the final print, potentially a harbinger for faster capital spending in 2017.
Then, BofA chimed in as to what has driven some of that rally in “Largest US Equity Outflows In 4 Months:”
While the S&P500 market may remain pinned just why of all time highs, this appears to be from ongoing short covering, and is not – at least in the latest week – the result of new money entering the market. Quite the opposite: according to the latest BofA fund flow analysis based on EPFR data, in the latest week, US equities saw $6.3 billion in outflows, the largest weekly redemption from US mutual funds and ETFs in four months, since before the presidential election. And as investors pulled cash out of US stocks, they quickly reallocated it back into bonds, with all major classes seeing inflows, with notable mentions for government bonds, which had the biggest inflows since July 2016, and TIPS, where the demand for inflation protection is now the highest since the great China reflation scare of 2011 (it proved quite transitory).
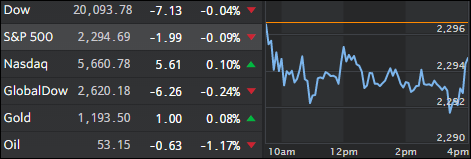
For the week, the major indexes gained and hit record highs while bonds ended barely unchanged. The US dollar fell for the 5th week in a row and closed at 2-month lows. Silver spiked back to even while gold was slammed back below the $1,200 level.
- ETFs in the Spotlight (updated for 2017)
In case you missed the announcement and description of this section, you can read it here again.
It features 10 broadly diversified and sector ETFs from my HighVolume list as posted every Saturday. Furthermore, they are screened for the lowest MaxDD% number meaning they have been showing better resistance to temporary sell offs than all others over the past year.
The below table simply demonstrates the magnitude with which some of the ETFs are fluctuating in regards to their positions above or below their respective individual trend lines (%M/A). A break below, represented by a negative number, shows weakness, while a break above, represented by a positive percentage, shows strength.
For hundreds of ETF choices, be sure to reference Thursday’s StatSheet.
Year to date, here’s how the 2017 candidates have fared so far:
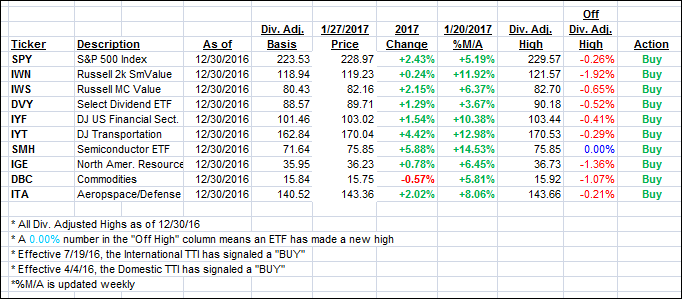
Again, the %M/A column above shows the position of the various ETFs in relation to their respective long term trend lines, while the trailing sell stops are being tracked in the “Off High” column. The “Action” column will signal a “Sell” once the -7.5% point has been taken out in the “Off High” column.
- Trend Tracking Indexes (TTIs)
Our Trend Tracking Indexes (TTIs) slipped a tad as the major indexes appeared to be going nowhere for the 2nd day in a row.
Here’s how we closed 1/27/2017:
Domestic TTI: +1.97% (last close +2.07%)—Buy signal effective 4/4/2016
International TTI: +5.18% (last close +5.49%)—Buy signal effective 7/19/2016
Disclosure: I am obliged to inform you that I, as well as my advisory clients, own some of the ETFs listed in the above table. Furthermore, they do not represent a specific investment recommendation for you, they merely show which ETFs from the universe I track are falling within the guidelines specified.
————————————————————-
READER Q & A FOR THE WEEK
All Reader Q & A’s are listed at our web site!
Check it out at:
https://theetfbully.com/questions-answers/
———————————————————-
WOULD YOU LIKE TO HAVE YOUR INVESTMENTS PROFESSIONALLY MANAGED?
Do you have the time to follow our investment plans yourself? If you are a busy professional who would like to have his portfolio managed using our methodology, please contact me directly or get more details at:
https://theetfbully.com/personal-investment-management/
———————————————————
Back issues of the ETF/No Load Fund Tracker are available on the web at:
https://theetfbully.com/newsletter-archives/
Contact Ulli