
- Moving the Markets
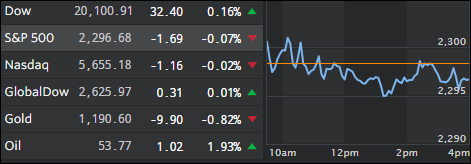
It was pretty much a day of consolidation after the Dow pierced the 20k milestone yesterday, however, the S&P 500 managed to touch the 2,300 level but backed off and closed 3 points below it.
Weighing on the S&P and Nasdaq was Qualcomm, which gave back 5% after a lower-than-expected rise in quarterly revenue. Still, the Dow managed to hold on to its 20k level and added 0.16% for the day.
Besides Trump’s business friendly decisions, earnings were center stage, have boosted sentiment and are expected to show a growth of 7%, which would make it the biggest increase in a couple of years. So far, 146 companies have reported earnings through this morning. 69.2% have topped expectations compared to an average of 63.6% over the last 23 years.
As I have posted repeatedly, reality and the stock market are two different and entirely separate things. Take a look at this chart, courtesy of ZH:
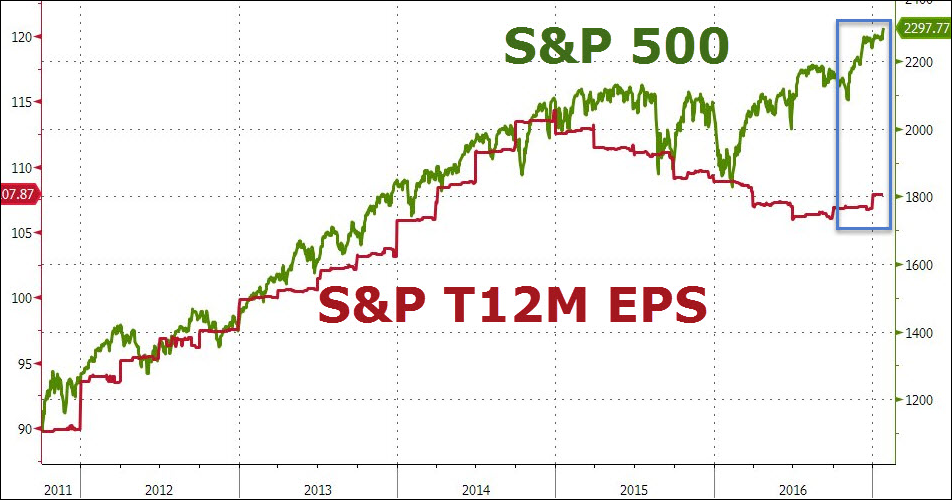
The gap between the S&P 500 level and its trailing 12 months earnings/share continues to widen. While this type of market manipulation can go on for a while, it must end eventually. That’s why we are always prepared to exit our positions should hope get crushed by reality.
- ETFs in the Spotlight (updated for 2017)
In case you missed the announcement and description of this section, you can read it here again.
It features 10 broadly diversified and sector ETFs from my HighVolume list as posted every Saturday. Furthermore, they are screened for the lowest MaxDD% number meaning they have been showing better resistance to temporary sell offs than all others over the past year.
The below table simply demonstrates the magnitude with which some of the ETFs are fluctuating in regards to their positions above or below their respective individual trend lines (%M/A). A break below, represented by a negative number, shows weakness, while a break above, represented by a positive percentage, shows strength.
For hundreds of ETF choices, be sure to reference Thursday’s StatSheet.
Year to date, here’s how the 2017 candidates have fared so far:
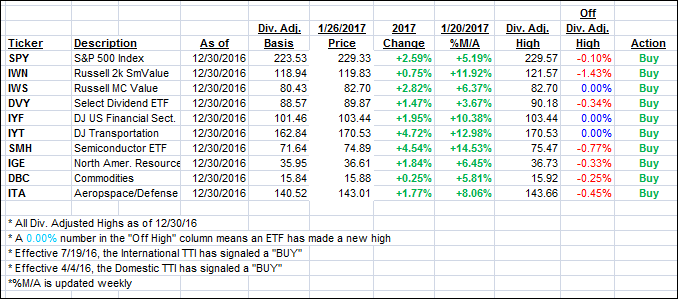
Again, the %M/A column above shows the position of the various ETFs in relation to their respective long term trend lines, while the trailing sell stops are being tracked in the “Off High” column. The “Action” column will signal a “Sell” once the -7.5% point has been taken out in the “Off High” column.
- Trend Tracking Indexes (TTIs)
Our Trend Tracking Indexes (TTIs) edged higher as the major indexes went sideways.
Here’s how we closed 1/26/2017:
Domestic TTI: +2.07% (last close +1.92%)—Buy signal effective 4/4/2016
International TTI: +5.49% (last close +5.25%)—Buy signal effective 7/19/2016
Disclosure: I am obliged to inform you that I, as well as my advisory clients, own some of the ETFs listed in the above table. Furthermore, they do not represent a specific investment recommendation for you, they merely show which ETFs from the universe I track are falling within the guidelines specified.
Contact Ulli