
- Moving the Markets
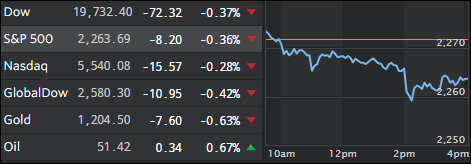
It was a mixed bag with upbeat economic news not being able to offset the anxiety about tomorrow’s inauguration. Besides sinking equities, bonds and gold dropped as well while the US dollar and crude oil bucked the trend and closed up.
On the economic front, housing starts rose but building permits inched slightly lower. Weekly initial jobless claims declined by 15k to 234k last week, which was below forecasts of 254k.
With the elite meeting in Davos, Switzerland, being in full swing, I saw this story confirming what I have been saying for a long time that all markets are manipulated by central banks. In this almost humorous article, China orders no market selloffs during President’s Davos trip:
State-owned investors bought shares to steady the market on Monday, while some funds were guided on Tuesday not to sell holdings with big weightings in benchmark indexes, the people said, asking not to be identified because they aren’t authorized to discuss the matter publicly. China’s securities regulators asked funds and brokerages to trade prudently this week and directed exchanges to report any abnormal transactions, the people said.
To be sure, Chinese authorities have traditionally intervened in markets before and during events of political significance, with government funds stepping in to boost stocks before a key meeting of the National People’s Congress last year and before a 2015 military parade celebrating the 70th anniversary of the World War II victory over Japan.
This is simply another confirmation that market manipulation is alive and well.
- ETFs in the Spotlight (updated for 2017)
In case you missed the announcement and description of this section, you can read it here again.
It features 10 broadly diversified and sector ETFs from my HighVolume list as posted every Saturday. Furthermore, they are screened for the lowest MaxDD% number meaning they have been showing better resistance to temporary sell offs than all others over the past year.
The below table simply demonstrates the magnitude with which some of the ETFs are fluctuating in regards to their positions above or below their respective individual trend lines (%M/A). A break below, represented by a negative number, shows weakness, while a break above, represented by a positive percentage, shows strength.
For hundreds of ETF choices, be sure to reference Thursday’s StatSheet.
Year to date, here’s how the 2017 candidates have fared so far:
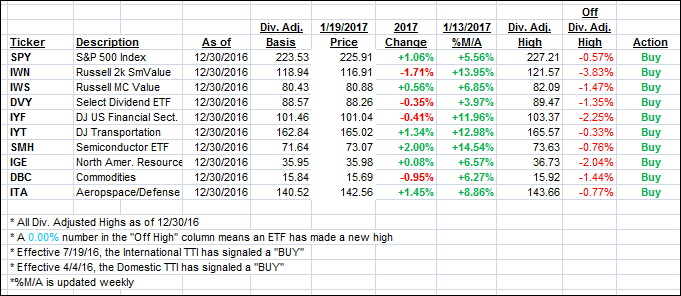
Again, the %M/A column above shows the position of the various ETFs in relation to their respective long term trend lines, while the trailing sell stops are being tracked in the “Off High” column. The “Action” column will signal a “Sell” once the -7.5% point has been taken out in the “Off High” column.
- Trend Tracking Indexes (TTIs)
Our Trend Tracking Indexes (TTIs) were mixed with the domestic one losing while the international one managed to inch higher.
Here’s how we closed 1/19/2017:
Domestic TTI: +1.36% (last close +1.57%)—Buy signal effective 4/4/2016
International TTI: +3.89% (last close +3.84%)—Buy signal effective 7/19/2016
Disclosure: I am obliged to inform you that I, as well as my advisory clients, own some of the ETFs listed in the above table. Furthermore, they do not represent a specific investment recommendation for you, they merely show which ETFs from the universe I track are falling within the guidelines specified.
Contact Ulli