
- Moving the Markets
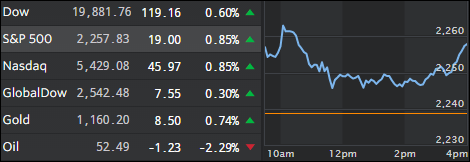
The markets started the New Year with a bang as the Dow attempted another run at 20k but fell short in the end as a mid-day sell-off pulled the rug out from the early rally. Late day buying put the major indexes deeper into the green for day, but it was not enough to reach and take out the morning highs. Nevertheless, the gains for the day were solid.
It was a wild ride as interest rates rose worldwide, but while the US 10-year yield headed north at first it ended up lower at 2.45%. Oil went into hyper-drive by touching the $55/barrel level and then crashing to end up at $52.56 for a loss from high to low of -4.4%.
Better than expected manufacturing data sent the US dollar surging, with the index now racing above its 2016 highs to its highest level since 2002. If this continues, there may be dire consequences, economically speaking, as the following areas will likely be affected:
- Corporate profits (47% of corporate sales from abroad)
- GDP growth
- Bonds (debt deflation)
- Mortgages and home refinancing
- US manufacturing
Indeed, there are few if any benefits to a strong $USD in the current fiat, debt-based monetary system the Fed is managing. Pushing for three (more) rate hikes with the $USD at 102 is like pushing your friend to drink three more beers when he’s already got alcohol poisoning.
- ETFs in the Spotlight (updated for 2017)
In case you missed the announcement and description of this section, you can read it here again.
It features 10 broadly diversified and sector ETFs from my HighVolume list as posted every Saturday. Furthermore, they are screened for the lowest MaxDD% number meaning they have been showing better resistance to temporary sell offs than all others over the past year.
The below table simply demonstrates the magnitude with which some of the ETFs are fluctuating in regards to their positions above or below their respective individual trend lines (%M/A). A break below, represented by a negative number, shows weakness, while a break above, represented by a positive percentage, shows strength.
For hundreds of ETF choices, be sure to reference Thursday’s StatSheet.
Year to date, here’s how the 2017 candidates have fared so far:
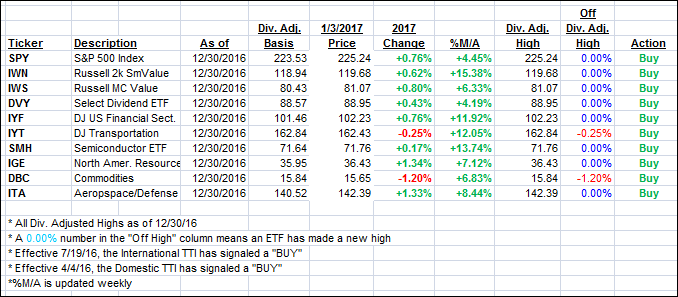
Again, the %M/A column above shows the position of the various ETFs in relation to their respective long term trend lines, while the trailing sell stops are being tracked in the “Off High” column. The “Action” column will signal a “Sell” once the -7.5% point has been taken out in the “Off High” column.
- Trend Tracking Indexes (TTIs)
Our Trend Tracking Indexes (TTIs) followed the major indexes higher as the first trading day of 2017 started out on a positive.
Here’s how we closed 1/3/2017:
Domestic TTI: +1.12% (last close +0.91%)—Buy signal effective 4/4/2016
International TTI: +1.92% (last close +1.80%)—Buy signal effective 7/19/2016
Disclosure: I am obliged to inform you that I, as well as my advisory clients, own some of the ETFs listed in the above table. Furthermore, they do not represent a specific investment recommendation for you, they merely show which ETFs from the universe I track are falling within the guidelines specified.
Contact Ulli