
- Moving the Markets
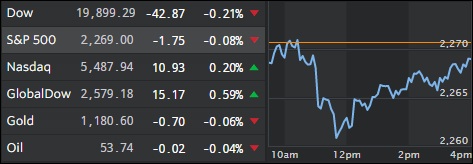
After a good start in the New Year, softness set in with the major indexes meandering aimlessly although the Nasdaq managed to eke out a small gain. Weighing on the broad market were sharp drops in Kohl’s and Macy’s after yesterday’s announcement that the holiday season was not only poor, but that also store closings are on the horizon and, in Macy’s case, total layoffs could reach 10,000. Not a good omen for the retail industry.
Bucking the losing trend was Amazon with a gain of 3%, which helped the Nasdaq to stay above the unchanged line. Market wavering was also caused by nervous investors now wanting more evidence that Trump’s ambitious campaign promises will actually be approved by lawmakers and then turned into reality.
ADP’s National Employment report added to the sour mood in that fewer jobs than expected were added in the private sector last month. For the real thing, all eyes will be on tomorrow’s comprehensive non-farm payroll report that covers both public sector and private hiring. It will be interesting to see if the market theme of the past “good news is good news and bad news is good news” will also prevail in 2017.
- ETFs in the Spotlight (updated for 2017)
In case you missed the announcement and description of this section, you can read it here again.
It features 10 broadly diversified and sector ETFs from my HighVolume list as posted every Saturday. Furthermore, they are screened for the lowest MaxDD% number meaning they have been showing better resistance to temporary sell offs than all others over the past year.
The below table simply demonstrates the magnitude with which some of the ETFs are fluctuating in regards to their positions above or below their respective individual trend lines (%M/A). A break below, represented by a negative number, shows weakness, while a break above, represented by a positive percentage, shows strength.
For hundreds of ETF choices, be sure to reference Thursday’s StatSheet.
Year to date, here’s how the 2017 candidates have fared so far:
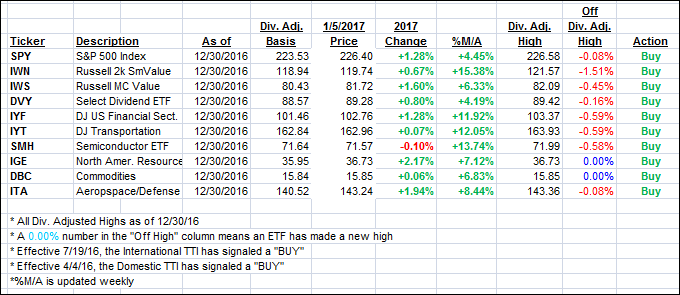
Again, the %M/A column above shows the position of the various ETFs in relation to their respective long term trend lines, while the trailing sell stops are being tracked in the “Off High” column. The “Action” column will signal a “Sell” once the -7.5% point has been taken out in the “Off High” column.
- Trend Tracking Indexes (TTIs)
Our Trend Tracking Indexes (TTIs) improved and turned more bullish despite the major indexes giving a sloppy performance.
Here’s how we closed 1/5/2017:
Domestic TTI: +1.59% (last close +1.45%)—Buy signal effective 4/4/2016
International TTI: +3.80% (last close +2.57%)—Buy signal effective 7/19/2016
Disclosure: I am obliged to inform you that I, as well as my advisory clients, own some of the ETFs listed in the above table. Furthermore, they do not represent a specific investment recommendation for you, they merely show which ETFs from the universe I track are falling within the guidelines specified.
Contact Ulli