
- Moving the Markets
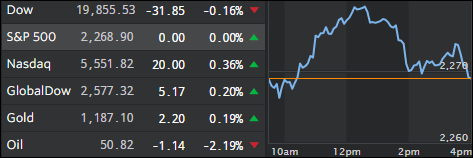
US oil got spanked again at the tune of -2.19% on top of yesterday’s 3.85% loss, hurting the energy sector and negating advances in the financial and healthcare arenas. The S&P was unchanged, but the Nasdaq managed to buck the trend again by advancing +0.36%.
Midday, it looked like the Dow might be successful with another attempt to conquer the 20k level by reaching 19,950, but selling pressure set in and down we went. I suspect that we may see more of this aimless meandering as traders are awaiting earnings season, and the January 20th inauguration, to get a better sense as to not just how but if Trump’s ambitious economic plan plays out as advertised.
In other words, the post-election exuberance has reached an end, and Wall Street appears to have settled into a wait-and-see mode before pushing the indexes further into bubble territory. Any suggestion that earnings are not what was expected, or Trump’s plans are not executable within a reasonable amount of time, and we’ll undoubtedly see a negative reaction in equities.
- ETFs in the Spotlight (updated for 2017)
In case you missed the announcement and description of this section, you can read it here again.
It features 10 broadly diversified and sector ETFs from my HighVolume list as posted every Saturday. Furthermore, they are screened for the lowest MaxDD% number meaning they have been showing better resistance to temporary sell offs than all others over the past year.
The below table simply demonstrates the magnitude with which some of the ETFs are fluctuating in regards to their positions above or below their respective individual trend lines (%M/A). A break below, represented by a negative number, shows weakness, while a break above, represented by a positive percentage, shows strength.
For hundreds of ETF choices, be sure to reference Thursday’s StatSheet.
Year to date, here’s how the 2017 candidates have fared so far:
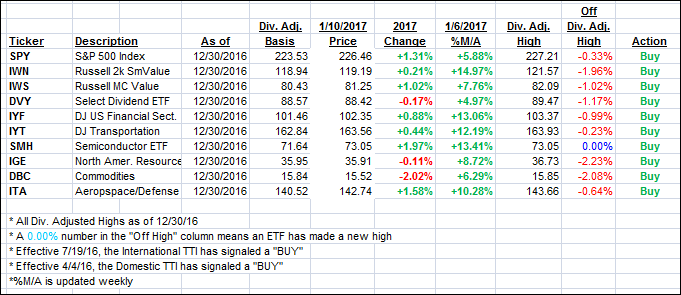
Again, the %M/A column above shows the position of the various ETFs in relation to their respective long term trend lines, while the trailing sell stops are being tracked in the “Off High” column. The “Action” column will signal a “Sell” once the -7.5% point has been taken out in the “Off High” column.
- Trend Tracking Indexes (TTIs)
Our Trend Tracking Indexes (TTIs) inched higher as the major indexes presented a mixed picture.
Here’s how we closed 1/10/2017:
Domestic TTI: +1.60% (last close +1.53%)—Buy signal effective 4/4/2016
International TTI: +3.67% (last close +3.48%)—Buy signal effective 7/19/2016
Disclosure: I am obliged to inform you that I, as well as my advisory clients, own some of the ETFs listed in the above table. Furthermore, they do not represent a specific investment recommendation for you, they merely show which ETFs from the universe I track are falling within the guidelines specified.
Contact Ulli