
- Moving the Markets
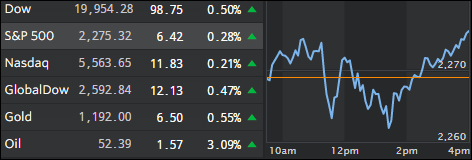
It was a wild ride for the major indexes as they vacillated above and below the unchanged line depending on the words of the moment during President-elect Trump’s first formal news conference since the election.
Case in point was the punishing effect on Biotech/Pharma stocks when Trump opined that that industry “was getting away with murder,” and that “we need new bidding procedures.” That’s all it took and Biotech/Pharma plunged the most since Brexit in June of 2016.
In the end, the S&P healthcare index ended the session down -1% after falling as much as 1.9% earlier on. The Biotech index was not as fortunate and sank -2.96%. That ended a 6-day winning streak for both indexes. Worries about the sector eased later in the session as Trump remained vague about any details on healthcare proposals.
Wall Street is in caution mode due to 2 big upcoming events namely the start of earnings season this Friday and Trumps inauguration a week later on January 20th. We now need to see some evidence that earnings are better than expected and can justify the market’s sugar high and that Trump will be able to deliver on his promises. Any disappointment and it may take a while longer for us to get to Dow 20k.
- ETFs in the Spotlight (updated for 2017)
In case you missed the announcement and description of this section, you can read it here again.
It features 10 broadly diversified and sector ETFs from my HighVolume list as posted every Saturday. Furthermore, they are screened for the lowest MaxDD% number meaning they have been showing better resistance to temporary sell offs than all others over the past year.
The below table simply demonstrates the magnitude with which some of the ETFs are fluctuating in regards to their positions above or below their respective individual trend lines (%M/A). A break below, represented by a negative number, shows weakness, while a break above, represented by a positive percentage, shows strength.
For hundreds of ETF choices, be sure to reference Thursday’s StatSheet.
Year to date, here’s how the 2017 candidates have fared so far:
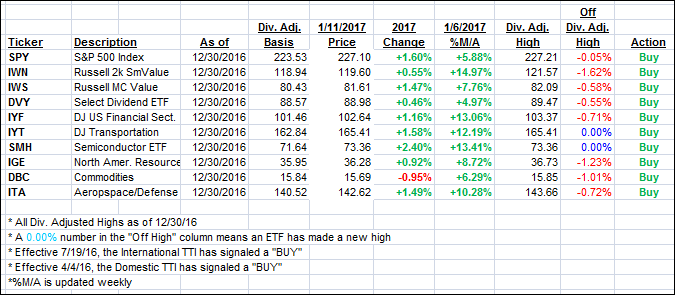
Again, the %M/A column above shows the position of the various ETFs in relation to their respective long term trend lines, while the trailing sell stops are being tracked in the “Off High” column. The “Action” column will signal a “Sell” once the -7.5% point has been taken out in the “Off High” column.
- Trend Tracking Indexes (TTIs)
Our Trend Tracking Indexes (TTIs) moved deeper into bullish territory as the major indexes staged a comeback during the last hour of trading.
Here’s how we closed 1/11/2017:
Domestic TTI: +1.71% (last close +1.60%)—Buy signal effective 4/4/2016
International TTI: +3.97% (last close +3.67%)—Buy signal effective 7/19/2016
Disclosure: I am obliged to inform you that I, as well as my advisory clients, own some of the ETFs listed in the above table. Furthermore, they do not represent a specific investment recommendation for you, they merely show which ETFs from the universe I track are falling within the guidelines specified.
Contact Ulli