
- Moving the Markets
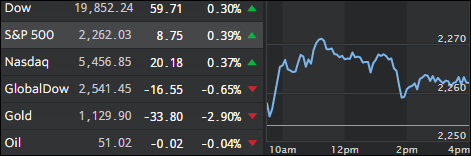
The major indexes managed to shake off yesterday’s pullback, which marked the day of the Fed’s second hike in interest rates in almost 10 years. While this was widely expected, I thought the markets would have taken that removal of uncertainty as a positive, but Yellen spoiled the party with her announcement that she anticipates three more hikes in 2017. Hmm, 4 rate hikes were promised for 2016 and only “one” materialized…
Interest rates continued to soar with the 10-year Treasury yield now reaching 2.60% from a July 2016 low of 1.37%. That is a huge move and, if we get close to the 3% milestone, there will be some fallout in the stock market as well.
Take a look at the graph below where I have charted the S&P 500 vs. the 10-year Treasury bond:
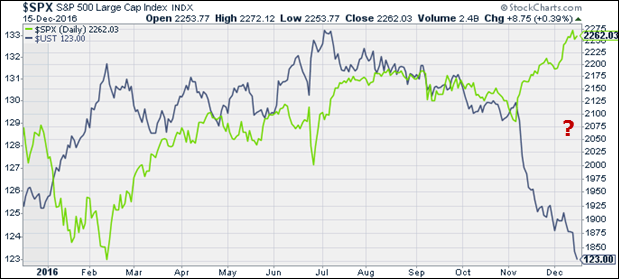
This divergence gap between the S&P 500 and the 10-year bond will have to narrow at some point. It could be that either bonds rally, the S&P 500 corrects to fair value, or a combination of both. The open ended question is not as to “if” but “when” this will occur.
- ETFs in the Spotlight
In case you missed the announcement and description of this section, you can read it here again.
It features 10 broadly diversified ETFs from my HighVolume list as posted every Monday. Furthermore, they are screened for the lowest MaxDD% number meaning they have been showing better resistance to temporary sell offs than all others over the past year.
Here are the 10 candidates:
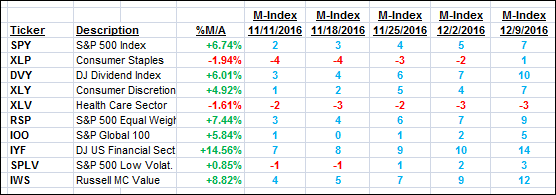
The above table simply demonstrates the magnitude with which some of the ETFs are fluctuating in regards to their positions above or below their respective individual trend lines (%M/A). A break below, represented by a negative number, shows weakness, while a break above, represented by a positive percentage, shows strength.
For hundreds of ETF choices, be sure to reference Thursday’s StatSheet.
Year to date, here’s how the above candidates have fared so far:
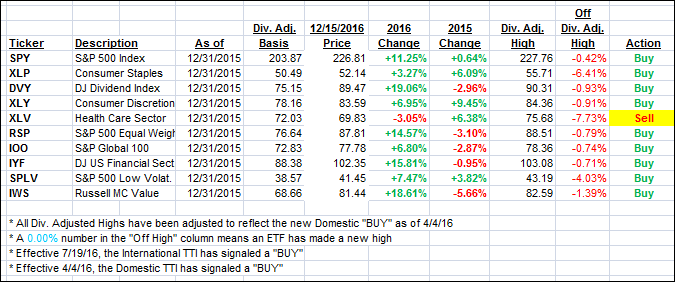
Again, the first table above shows the position of the various ETFs in relation to their respective long term trend lines (%M/A), while the second one tracks their trailing sell stops in the “Off High” column. The “Action” column will signal a “Sell” once the -7.5% point has been taken out in the “Off High” column.
- Trend Tracking Indexes (TTIs)
Our Trend Tracking Indexes (TTIs) followed the major indexes and edged higher.
Here’s how we closed 12/15/2016:
Domestic TTI: +1.31% (last close +1.21%)—Buy signal effective 4/4/2016
International TTI: +2.90% (last close +2.82%)—Buy signal effective 7/19/2016
Disclosure: I am obliged to inform you that I, as well as my advisory clients, own some of the ETFs listed in the above table. Furthermore, they do not represent a specific investment recommendation for you, they merely show which ETFs from the universe I track are falling within the guidelines specified.
Contact Ulli