
- Moving the Markets
After last week’s rip-roaring run, during which the major indexes scored some solid ground, time for a break was much overdue, especially in view of the Fed’s upcoming meeting on interest rates. The final verdict will be due out on Wednesday with the odds being still close to 100% in favor of a rate hike.
As I’ve commented before, it’s not that the economic environment is justifying an increase in rates; it’s more like the Fed will finally have to deliver after crying wolf all year. At least that’s the consensus. To me it would seem that if the Fed disappoints and holds steady, the markets may stage a sell-off while, on the other hand, if the expected increase occurs, we may see a temporary pick up in the rally as this uncertainty is finally over.
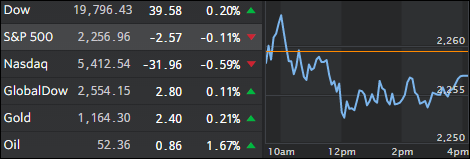
Financials were leading the decliners today, the 10 year US Treasury yield ticked up some 6 basis points to 2.49% from an election reading of 1.8%. Crude oil jumped 1.83% and pushed the energy sector higher, while the US dollar slipped -0.57%.
- ETFs in the Spotlight
In case you missed the announcement and description of this section, you can read it here again.
It features 10 broadly diversified ETFs from my HighVolume list as posted every Monday. Furthermore, they are screened for the lowest MaxDD% number meaning they have been showing better resistance to temporary sell offs than all others over the past year.
Here are the 10 candidates:
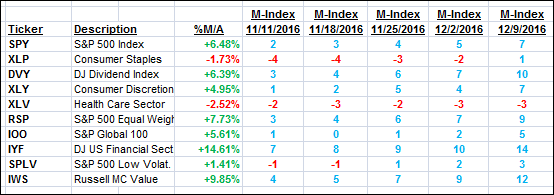
The above table simply demonstrates the magnitude with which some of the ETFs are fluctuating in regards to their positions above or below their respective individual trend lines (%M/A). A break below, represented by a negative number, shows weakness, while a break above, represented by a positive percentage, shows strength.
For hundreds of ETF choices, be sure to reference Thursday’s StatSheet.
Year to date, here’s how the above candidates have fared so far:
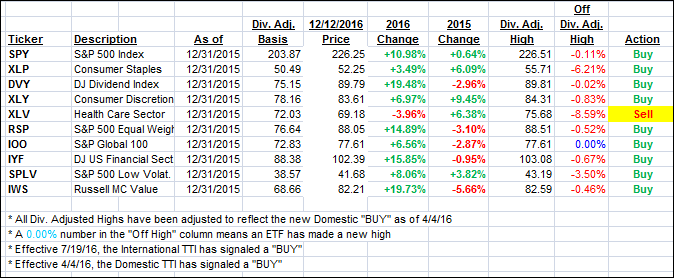
Again, the first table above shows the position of the various ETFs in relation to their respective long term trend lines (%M/A), while the second one tracks their trailing sell stops in the “Off High” column. The “Action” column will signal a “Sell” once the -7.5% point has been taken out in the “Off High” column.
- Trend Tracking Indexes (TTIs)
Our Trend Tracking Indexes (TTIs) both slipped as the markets went sideways as anxiety about Wednesday’s Fed meeting on interest rates took center stage.
Here’s how we closed 12/12/2016:
Domestic TTI: +1.40% (last close +1.57%)—Buy signal effective 4/4/2016
International TTI: +3.35% (last close +3.50%)—Buy signal effective 7/19/2016
Disclosure: I am obliged to inform you that I, as well as my advisory clients, own some of the ETFs listed in the above table. Furthermore, they do not represent a specific investment recommendation for you, they merely show which ETFs from the universe I track are falling within the guidelines specified.
Contact Ulli