
- Moving the Markets
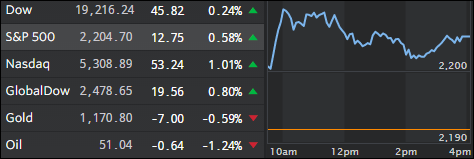
I had to laugh this morning after the Italian referendum was soundly defeated putting the Eurozone banking system in danger zone in regards to a much needed bailout of the Italian banks, but Europe stocks rallied sharply with the German Dax gaining 1.63%. As one trader remarked “Brexit took 3 days to recover its losses, Trump took 3 hours and Italeave took 3 minutes…”
Not to be outdone, the US markets followed suit, after a weak ending last week, and ratcheted higher with the S&P 500 adding 0.58%. Right now, we’re back to the moment in time where all news is good news, such as the view that the Fed is set to raise rates next week, which used to be a negative for stocks. However, a hike in rates is now seen as a positive due to it benefiting the banking sector. Go figure…
The quote of the day goes to Michael Block on why the market is rallying following the Italian referendum:
…[Apparently] the pattern of fading a potential crisis and then scrambling to cover and get long when everyone takes a breath and realizes that this time is not the apocalypse either still holds more than ever. I can’t justify any of this. The lesson investors and traders are getting is that everything is a buying opportunity and you need to not miss the boat. Brexit? Bullish. Trump winning the election? Bullish. Italy saying no to the referendum and the Prime Minister handing in his resignation? Bullish. Heck, all we need is a coup d’etat in India and the entire Belgian banking system to go kablooey and the S&P 500 will be at 3,000 by Christmas Eve.
- ETFs in the Spotlight
In case you missed the announcement and description of this section, you can read it here again.
It features 10 broadly diversified ETFs from my HighVolume list as posted every Monday. Furthermore, they are screened for the lowest MaxDD% number meaning they have been showing better resistance to temporary sell offs than all others over the past year.
Here are the 10 candidates:
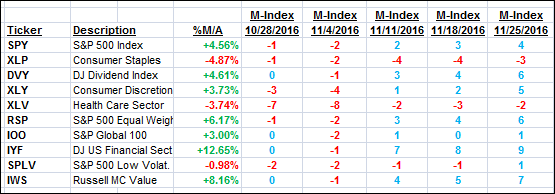
The above table simply demonstrates the magnitude with which some of the ETFs are fluctuating in regards to their positions above or below their respective individual trend lines (%M/A). A break below, represented by a negative number, shows weakness, while a break above, represented by a positive percentage, shows strength.
For hundreds of ETF choices, be sure to reference Thursday’s StatSheet.
Year to date, here’s how the above candidates have fared so far:
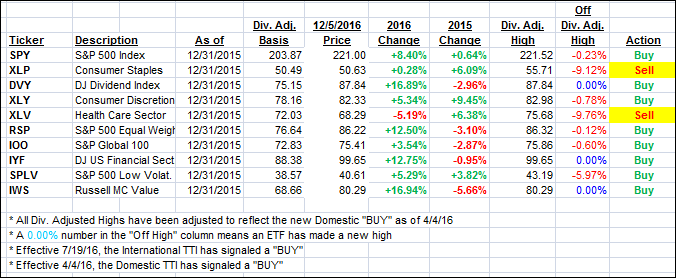
Again, the first table above shows the position of the various ETFs in relation to their respective long term trend lines (%M/A), while the second one tracks their trailing sell stops in the “Off High” column. The “Action” column will signal a “Sell” once the -7.5% point has been taken out in the “Off High” column.
- Trend Tracking Indexes (TTIs)
Our Trend Tracking Indexes (TTIs) reversed and joined the Italexit rally as all three major indexes closed up to varying degrees on the day.
Here’s how we closed 12/5/2016:
Domestic TTI: +0.71% (last close +0.34%)—Buy signal effective 4/4/2016
International TTI: +2.10% (last close +1.48%)—Buy signal effective 7/19/2016
Disclosure: I am obliged to inform you that I, as well as my advisory clients, own some of the ETFs listed in the above table. Furthermore, they do not represent a specific investment recommendation for you, they merely show which ETFs from the universe I track are falling within the guidelines specified.
Contact Ulli