
- Moving the Markets
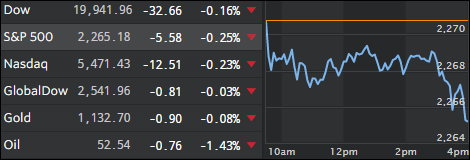
The major indexes pulled back for a change as volume and the hunt for Dow 20,000 slowed down ahead of the Christmas Holiday. Healthcare and real estate were the primary losers today.
Banking stocks in Europe round-tripped this morning as the shares of Italy’s problem child, Monte Paschi, crashed, soared and plunged again amidst on-again, off-again bail-out headlines. It now appears that the bloodletting has also spread to Spanish banks following a court ruling against them for mortgage fraud.
I think these EU problems are just the beginning, so it’s important to note that the consequences of Italy’s banks owning $360 billion in non-performing loans will spread at some point to France and Germany and subsequently make it across the pond to the U.S. While this may not be imminent, it’s something to keep an eye on.
After some of the investment heavyweights like Bill Gross and Jeff Gundlach have been commenting in regards to the reckless post-election rally with things like “there is going to be a buyer’s remorse period,” it was El-Erian’s turn today agreeing that “now is a good time to take advantage of the latest rallies in global financial markets and scale back from risk,” along with “it makes total sense to take some money off the table.”
I especially liked his viewpoint that “We’ve priced in no policy mistakes. We’ve priced in no market accidents, and we’ve ignored all sorts of political issues.” So, let me be the voice of reason again, just as the Dow may make another attempt at breaking the 20,000 barrier, and point out the importance of having a sell stop discipline in place.
Bob Farrell’s market rule #2 says it best: “Excess in one direction will lead to an opposite excess in the other direction.”
Just be prepared.
- ETFs in the Spotlight
In case you missed the announcement and description of this section, you can read it here again.
It features 10 broadly diversified ETFs from my HighVolume list as posted every Saturday. Furthermore, they are screened for the lowest MaxDD% number meaning they have been showing better resistance to temporary sell offs than all others over the past year.
Here are the 10 candidates:
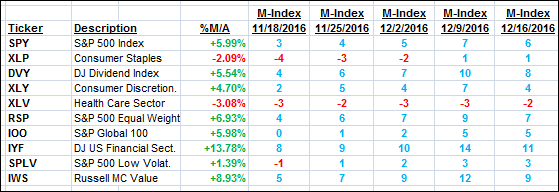
The above table simply demonstrates the magnitude with which some of the ETFs are fluctuating in regards to their positions above or below their respective individual trend lines (%M/A). A break below, represented by a negative number, shows weakness, while a break above, represented by a positive percentage, shows strength.
For hundreds of ETF choices, be sure to reference Thursday’s StatSheet.
Year to date, here’s how the above candidates have fared so far:
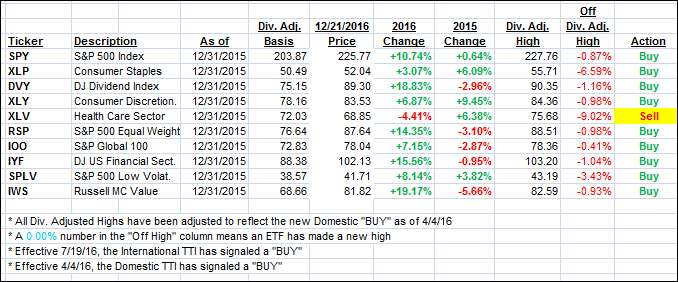
Again, the first table above shows the position of the various ETFs in relation to their respective long term trend lines (%M/A), while the second one tracks their trailing sell stops in the “Off High” column. The “Action” column will signal a “Sell” once the -7.5% point has been taken out in the “Off High” column.
- Trend Tracking Indexes (TTIs)
Our Trend Tracking Indexes (TTIs) slipped a tad as the major indexes closed below the unchanged line.
Here’s how we closed 12/21/2016:
Domestic TTI: +1.39% (last close +1.44%)—Buy signal effective 4/4/2016
International TTI: +2.50% (last close +2.56%)—Buy signal effective 7/19/2016
Disclosure: I am obliged to inform you that I, as well as my advisory clients, own some of the ETFs listed in the above table. Furthermore, they do not represent a specific investment recommendation for you, they merely show which ETFs from the universe I track are falling within the guidelines specified.
Contact Ulli