
- Moving the Markets
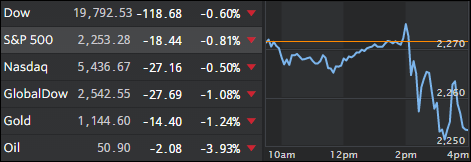
Despite the odds of the Fed hiking rates today having been close to 100%, Wall Street traders went on strike as the post-election bullish momentum waned, and the major indexes sold off by a modest amount which, however, was the worst pull-back in two months.
The Fed finally came through after crying “wolf” all year and hiked interest rates by an expected 0.25% but signaled that future increases could come next year at an increased pace. It’s the latter, I believe, that pulled the rug out from the buying crowd as fiscal assumptions now trend towards slightly faster growth and lower unemployment under a Trump regime.
On the economic front, things don’t seem to indicate any of that faster growth as GDP hopes faded with business inventories dropping worse than expected (-0.2% MoM). Industrial production disappointed big time by declining for the 15th straight month (-0.6% YoY). And to top it off, retail sales growth for November clocked in at a lame 0.1% MoM missing expectations of a 0.3% advance; sales of motor vehicles tumbled 0.5% MoM.
It just goes to show that the “disconnect” between stock market levels and economic fundamentals is alive and well and as wide as ever. Go figure…
- ETFs in the Spotlight
In case you missed the announcement and description of this section, you can read it here again.
It features 10 broadly diversified ETFs from my HighVolume list as posted every Monday. Furthermore, they are screened for the lowest MaxDD% number meaning they have been showing better resistance to temporary sell offs than all others over the past year.
Here are the 10 candidates:
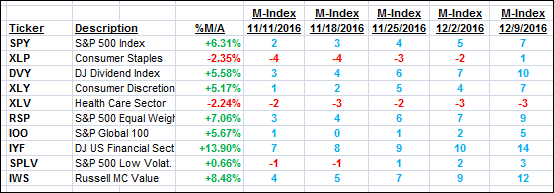
The above table simply demonstrates the magnitude with which some of the ETFs are fluctuating in regards to their positions above or below their respective individual trend lines (%M/A). A break below, represented by a negative number, shows weakness, while a break above, represented by a positive percentage, shows strength.
For hundreds of ETF choices, be sure to reference Thursday’s StatSheet.
Year to date, here’s how the above candidates have fared so far:
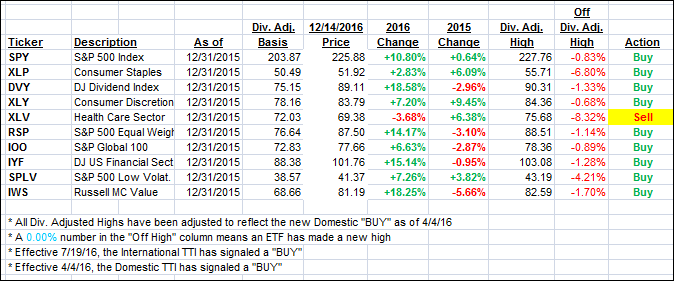
Again, the first table above shows the position of the various ETFs in relation to their respective long term trend lines (%M/A), while the second one tracks their trailing sell stops in the “Off High” column. The “Action” column will signal a “Sell” once the -7.5% point has been taken out in the “Off High” column.
- Trend Tracking Indexes (TTIs)
Our Trend Tracking Indexes (TTIs) reversed as the major indexes pulled back after the Fed’s first rate hike in 12 months.
Here’s how we closed 12/14/2016:
Domestic TTI: +1.21% (last close +1.67%)—Buy signal effective 4/4/2016
International TTI: +2.82% (last close +3.90%)—Buy signal effective 7/19/2016
Disclosure: I am obliged to inform you that I, as well as my advisory clients, own some of the ETFs listed in the above table. Furthermore, they do not represent a specific investment recommendation for you, they merely show which ETFs from the universe I track are falling within the guidelines specified.
Contact Ulli