
- Moving the Markets
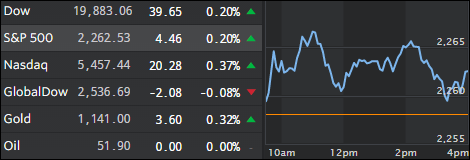
It was a reluctant rally with investors being hesitant considering that the major indexes were still hovering near all-time highs; bond markets finally managed to stage a modest recovery after the drubbing of the past few weeks.
Not helping matters were reports from Germany that a truck ran into a crowded Christmas market in Berlin killing 9 and injuring an estimated 50 people. In Turkey, the Russian Ambassador in charge of Syrian piece-talks was attacked and killed as he was getting ready to give a speech.
And, of course, today was voting day for the Electoral College the official result of which will not be known until early next year.
Hong Kong stocks corrected, Italian banks crashed, the NYSE suspended trading for a while, after which equities rallied, and we’re still waiting for the moment in time that the Dow hits the 20,000 level or has two down days in a row, which it has not seen for 7 weeks.
It was a tumultuous day with no clear direction.
- ETFs in the Spotlight
In case you missed the announcement and description of this section, you can read it here again.
It features 10 broadly diversified ETFs from my HighVolume list as posted every Monday. Furthermore, they are screened for the lowest MaxDD% number meaning they have been showing better resistance to temporary sell offs than all others over the past year.
Here are the 10 candidates:
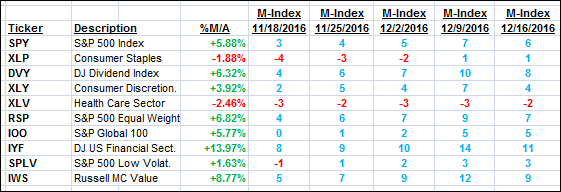
The above table simply demonstrates the magnitude with which some of the ETFs are fluctuating in regards to their positions above or below their respective individual trend lines (%M/A). A break below, represented by a negative number, shows weakness, while a break above, represented by a positive percentage, shows strength.
For hundreds of ETF choices, be sure to reference Thursday’s StatSheet.
Year to date, here’s how the above candidates have fared so far:
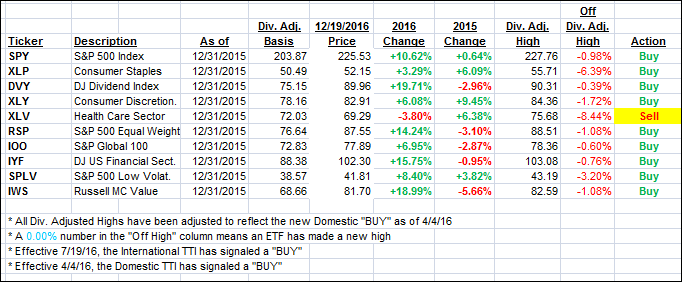
Again, the first table above shows the position of the various ETFs in relation to their respective long term trend lines (%M/A), while the second one tracks their trailing sell stops in the “Off High” column. The “Action” column will signal a “Sell” once the -7.5% point has been taken out in the “Off High” column.
- Trend Tracking Indexes (TTIs)
Our Trend Tracking Indexes (TTIs) were mixed with the Domestic one going nowhere while the International one retreated.
Here’s how we closed 12/19/2016:
Domestic TTI: +1.30% (last close +1.16%)—Buy signal effective 4/4/2016
International TTI: +2.35% (last close +2.85%)—Buy signal effective 7/19/2016
Disclosure: I am obliged to inform you that I, as well as my advisory clients, own some of the ETFs listed in the above table. Furthermore, they do not represent a specific investment recommendation for you, they merely show which ETFs from the universe I track are falling within the guidelines specified.
Contact Ulli