
- Moving the Markets
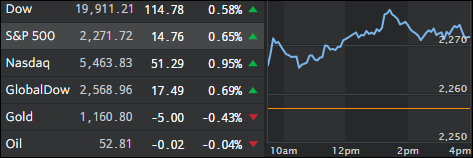
Yesterday’s pause in the market, during which the S&P 500 and the Nasdaq pulled back slightly, formed the basis for more advances today as the Dow reached a point that is within striking distance of the magical 20,000 milestone marker.
All three major indexes stormed into record high territory as the post-election levitation has not shown any signs of a slowdown—so far. Nine of the eleven major S&P sectors advanced with technology being the top dog of the day sporting a gain of +1.23%.
Surely, this parabolic rally will not go on forever as it is based on nothing but hope that Trump and his GOP-controlled congress will enact pro-growth policies. Still, valuations are way out of wack with the S&P 500 trading at an outrageous 17.7 times forward 12-month earnings. This compares to a 10-year median of 14.7 times.
For the time being, the environment remains bullish with all eyes now focused on the Fed’s announcement tomorrow about interest rates. A quarter-point increase has been priced in the markets and, should this materialize, we could see Dow 20,000 by the end of tomorrow’s trading day.
- ETFs in the Spotlight
In case you missed the announcement and description of this section, you can read it here again.
It features 10 broadly diversified ETFs from my HighVolume list as posted every Monday. Furthermore, they are screened for the lowest MaxDD% number meaning they have been showing better resistance to temporary sell offs than all others over the past year.
Here are the 10 candidates:
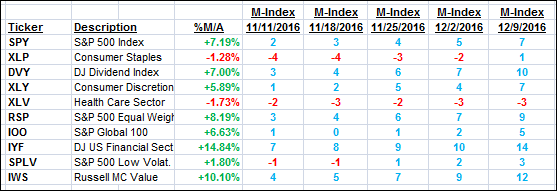
The above table simply demonstrates the magnitude with which some of the ETFs are fluctuating in regards to their positions above or below their respective individual trend lines (%M/A). A break below, represented by a negative number, shows weakness, while a break above, represented by a positive percentage, shows strength.
For hundreds of ETF choices, be sure to reference Thursday’s StatSheet.
Year to date, here’s how the above candidates have fared so far:
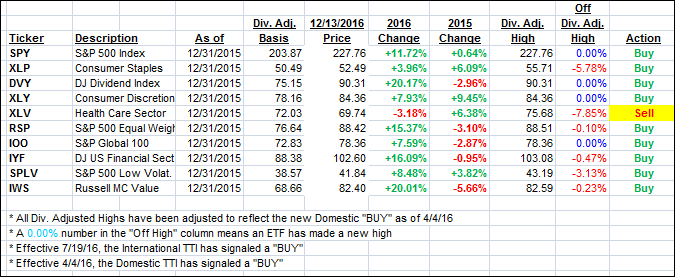
Again, the first table above shows the position of the various ETFs in relation to their respective long term trend lines (%M/A), while the second one tracks their trailing sell stops in the “Off High” column. The “Action” column will signal a “Sell” once the -7.5% point has been taken out in the “Off High” column.
- Trend Tracking Indexes (TTIs)
Our Trend Tracking Indexes (TTIs) headed north as the major indexes picked up steam and closed higher.
Here’s how we closed 12/13/2016:
Domestic TTI: +1.67% (last close +1.40%)—Buy signal effective 4/4/2016
International TTI: +3.90% (last close +3.35%)—Buy signal effective 7/19/2016
Disclosure: I am obliged to inform you that I, as well as my advisory clients, own some of the ETFs listed in the above table. Furthermore, they do not represent a specific investment recommendation for you, they merely show which ETFs from the universe I track are falling within the guidelines specified.
Contact Ulli