
- Moving the Markets
The recklessness and utter abandon with which the markets have been rallying, since the election, is simply astounding. Caution, risk aversion or view of economic fundamentals do either not exist or are simply ignored. It is financial engineering combined with market manipulation at its finest.
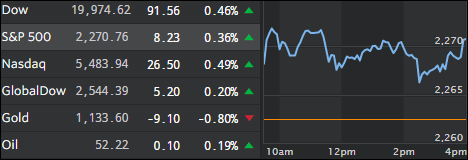
Such was the case again today as the Dow attempted to breach the 20,000 level but failed; however, the dollar kept on chugging along and rose to its highest levels in 14 years, which is not a good thing for companies involved in exports due to them possibly being priced out of some markets. About 40% of the S&P 500 members are selling internationally and any possible fallout will sure be known over the next two quarters.
Wall Street’s focus and the main driver of this rally remain fixed on one thing and one thing only: The Trump agenda with its tax cuts, infrastructure spending, deregulation and the subsequent anticipated boost to businesses.
In the end, it’s nothing but hope with 2017 economic growth expectations remaining stuck near cycle lows as the chart shows:
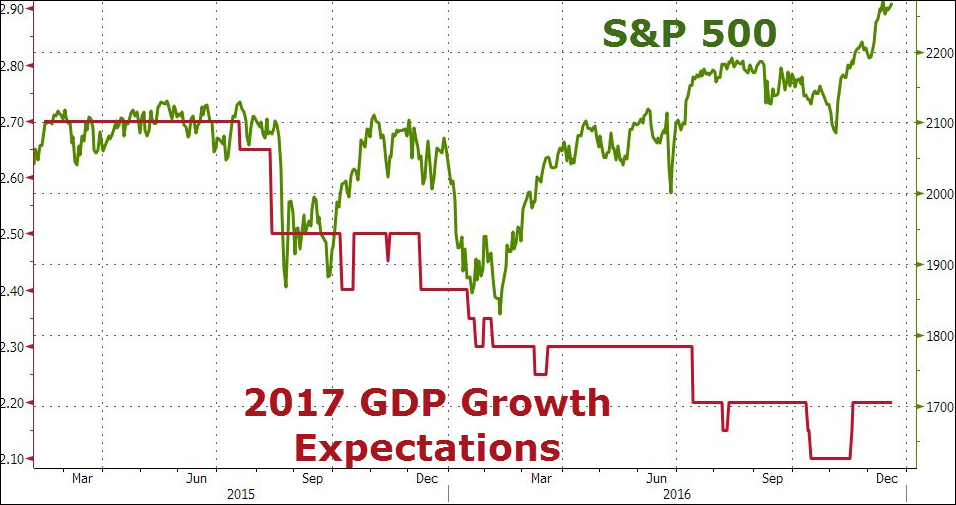
Chart courtesy of ZH
- ETFs in the Spotlight
In case you missed the announcement and description of this section, you can read it here again.
It features 10 broadly diversified ETFs from my HighVolume list as posted every Saturday. Furthermore, they are screened for the lowest MaxDD% number meaning they have been showing better resistance to temporary sell offs than all others over the past year.
Here are the 10 candidates:
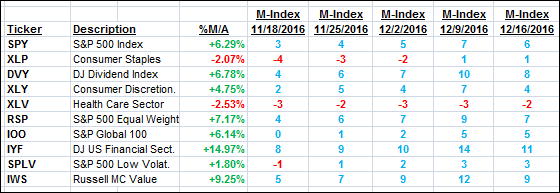
The above table simply demonstrates the magnitude with which some of the ETFs are fluctuating in regards to their positions above or below their respective individual trend lines (%M/A). A break below, represented by a negative number, shows weakness, while a break above, represented by a positive percentage, shows strength.
For hundreds of ETF choices, be sure to reference Thursday’s StatSheet.
Year to date, here’s how the above candidates have fared so far:
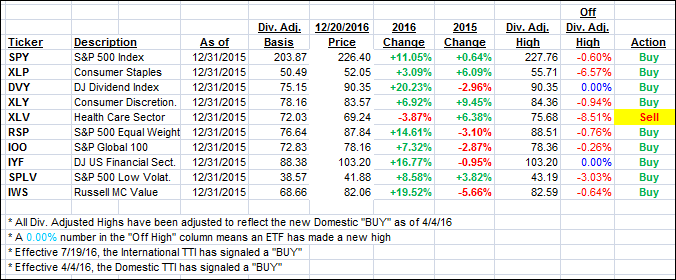
Again, the first table above shows the position of the various ETFs in relation to their respective long term trend lines (%M/A), while the second one tracks their trailing sell stops in the “Off High” column. The “Action” column will signal a “Sell” once the -7.5% point has been taken out in the “Off High” column.
- Trend Tracking Indexes (TTIs)
Our Trend Tracking Indexes (TTIs) headed higher as the Dow inched closer to its 20,000 milestone.
Here’s how we closed 12/20/2016:
Domestic TTI: +1.44% (last close +1.30%)—Buy signal effective 4/4/2016
International TTI: +2.56% (last close +2.35%)—Buy signal effective 7/19/2016
Disclosure: I am obliged to inform you that I, as well as my advisory clients, own some of the ETFs listed in the above table. Furthermore, they do not represent a specific investment recommendation for you, they merely show which ETFs from the universe I track are falling within the guidelines specified.
Contact Ulli