
- Moving the Markets
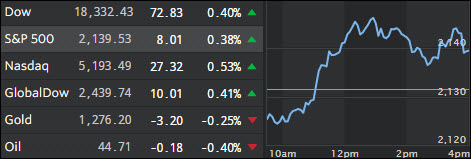
It was one of the worst kept secrets on Wall Street: Traders prefer a Clinton victory. Yesterday’s rally continued today, although far more cautiously, as the investment community sees the former secretary of state as a status quo candidate, a much preferred choice. It implies that alleged stability in the markets, aka the hope that continued support by the Fed to push up values even deeper into bubble territory, will remain business as usual.
Of course, should the traders be right about a Clinton win, the open ended question is as to how long this enthusiasm will last before reality sets in again, as we are facing a flow of worsening economic data points amidst the Fed’s recent “promise” to raise rates in December despite a deteriorating economy.
Much uncertainty awaits the markets, and there is still the possibility that Trump might win. If he does, the “feel good rally” of the past 2 days will disappear in a hurry. But, for right now, all is well on Wall Street with the 9-day losing streak of the S&P 500 having been broken and replaced with a “hope” rally.
- ETFs in the Spotlight
In case you missed the announcement and description of this section, you can read it here again.
It features 10 broadly diversified ETFs from my HighVolume list as posted every Monday. Furthermore, they are screened for the lowest MaxDD% number meaning they have been showing better resistance to temporary sell offs than all others over the past year.
Here are the 10 candidates:
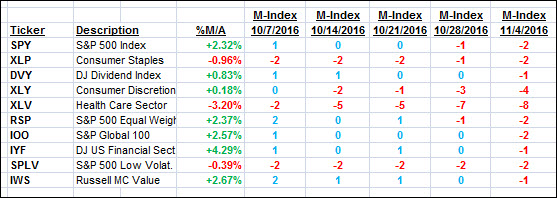
The above table simply demonstrates the magnitude with which some of the ETFs are fluctuating in regards to their positions above or below their respective individual trend lines (%M/A). A break below, represented by a negative number, shows weakness, while a break above, represented by a positive percentage, shows strength.
For hundreds of ETF choices, be sure to reference Thursday’s StatSheet.
Year to date, here’s how the above candidates have fared so far:
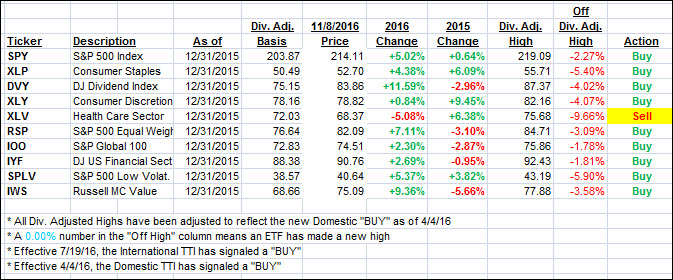
Again, the first table above shows the position of the various ETFs in relation to their respective long term trend lines (%M/A), while the second one tracks their trailing sell stops in the “Off High” column. The “Action” column will signal a “Sell” once the -7.5% point has been taken out in the “Off High” column.
- Trend Tracking Indexes (TTIs)
Our Trend Tracking Indexes (TTIs) followed the major indexes higher and are confirming the bullish bias for the moment. Let’s wait and see if an election hangover materializes over the next week or so.
Here’s how we closed 11/8/2016:
Domestic TTI: +0.76% (last close +0.67%)—Buy signal effective 4/4/2016
International TTI: +2.00% (last close +1.84%)—Buy signal effective 7/19/2016
Disclosure: I am obliged to inform you that I, as well as my advisory clients, own some of the ETFs listed in the above table. Furthermore, they do not represent a specific investment recommendation for you, they merely show which ETFs from the universe I track are falling within the guidelines specified.
Contact Ulli