
- Moving the Markets
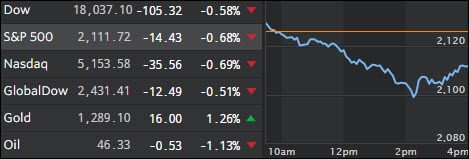
Things looked dicey for a while as the major indexes headed south driven by mixed economic data, election-related news and concern over prospects for higher interest rates.
The S&P 500 briefly touched the 2,099 level before bouncing higher as a modest afternoon rebound limited today’s losses. Today’s close was the lowest since July 7 as the widely assumed presidential race tightened and brought into question Clinton’s widely priced in win.
Adding more uncertainty is the current Fed meeting with its statement due on Wednesday. While it’s a forgone conclusion that there will be no rate hike this month, Wall Street will be looking for signs of a possible hike in December.
Our Trend Tracking Indexes (TTIs) continue to weaken with the Domestic TTI heading towards a possible trend line break into bear market territory. You can see the latest numbers in section 3 below. Be sure to tune in regularly so you don’t miss the point in time when the next “Sell” signal occurs.
- ETFs in the Spotlight
In case you missed the announcement and description of this section, you can read it here again.
It features 10 broadly diversified ETFs from my HighVolume list as posted every Monday. Furthermore, they are screened for the lowest MaxDD% number meaning they have been showing better resistance to temporary sell offs than all others over the past year.
Here are the 10 candidates:
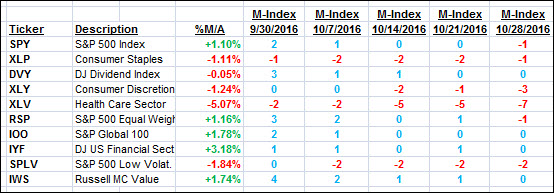
The above table simply demonstrates the magnitude with which some of the ETFs are fluctuating in regards to their positions above or below their respective individual trend lines (%M/A). A break below, represented by a negative number, shows weakness, while a break above, represented by a positive percentage, shows strength.
For hundreds of ETF choices, be sure to reference Thursday’s StatSheet.
Year to date, here’s how the above candidates have fared so far:
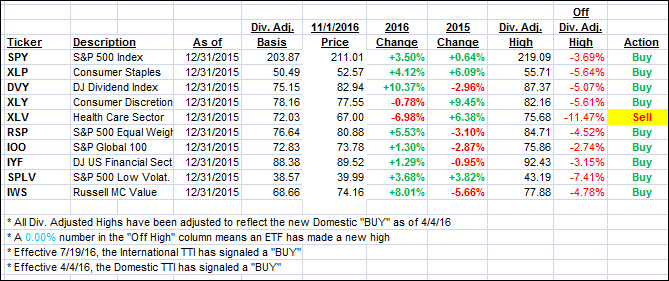
Again, the first table above shows the position of the various ETFs in relation to their respective long term trend lines (%M/A), while the second one tracks their trailing sell stops in the “Off High” column. The “Action” column will signal a “Sell” once the -7.5% point has been taken out in the “Off High” column.
- Trend Tracking Indexes (TTIs)
Our Trend Tracking Indexes (TTIs) headed south as the recent sell-off picked up speed. While we still remain on the bullish side of the trend line, we may very well break it to the downside before the elections if this weakness continues.
Here’s how we closed 11/1/2016:
Domestic TTI: +0.47% (last close +0.76%)—Buy signal effective 4/4/2016
International TTI: +2.00% (last close +2.43%)—Buy signal effective 7/19/2016
Disclosure: I am obliged to inform you that I, as well as my advisory clients, own some of the ETFs listed in the above table. Furthermore, they do not represent a specific investment recommendation for you, they merely show which ETFs from the universe I track are falling within the guidelines specified.
Contact Ulli