
- Moving the Markets
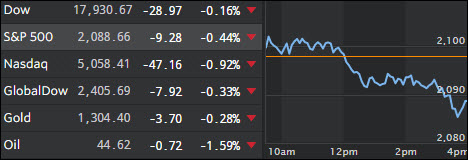
The market environment is getting shaky with the S&P now down 8 days in a row, which is the longest losing streak since Lehman collapsed in 2008. So, it’s no surprise that the volatility index (VIX) shared this dubious record by having rallied for 8 straight days, which is only the 3rd time in history this has happened with the other dates being April 2012 and December 2013. (Hat tip to ZH for this data).
As I said yesterday, the pullback has been orderly and lacked magnitude, but odds seem to be increasing that downside momentum could accelerate with a vengeance, especially if an outsider like Trump were to win the elections next week.
Not helping the indexes today were several disappointing earnings and economic reports. Factory orders and initial jobless claims came in less than expected making tomorrow’s payroll report the center of attention in the hope that it could spark a rebound rally. It was interesting to note that today’s bad news was in fact bad news as the major indexes headed lower and not higher as they have been for most of this year. Is this a sign of things to come?
- ETFs in the Spotlight
In case you missed the announcement and description of this section, you can read it here again.
It features 10 broadly diversified ETFs from my HighVolume list as posted every Monday. Furthermore, they are screened for the lowest MaxDD% number meaning they have been showing better resistance to temporary sell offs than all others over the past year.
Here are the 10 candidates:
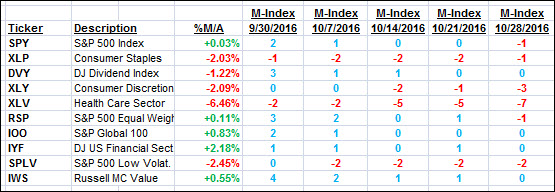
The above table simply demonstrates the magnitude with which some of the ETFs are fluctuating in regards to their positions above or below their respective individual trend lines (%M/A). A break below, represented by a negative number, shows weakness, while a break above, represented by a positive percentage, shows strength.
For hundreds of ETF choices, be sure to reference Thursday’s StatSheet.
Year to date, here’s how the above candidates have fared so far:
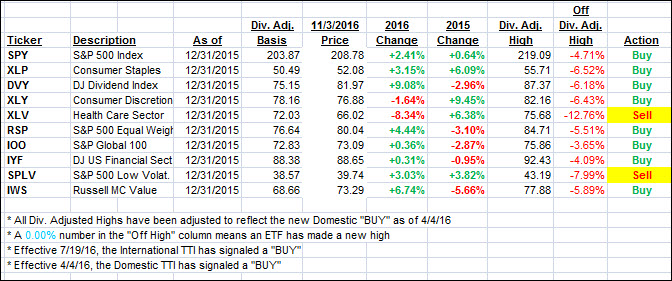
Again, the first table above shows the position of the various ETFs in relation to their respective long term trend lines (%M/A), while the second one tracks their trailing sell stops in the “Off High” column. The “Action” column will signal a “Sell” once the -7.5% point has been taken out in the “Off High” column.
- Trend Tracking Indexes (TTIs)
Our Trend Tracking Indexes (TTIs) dropped again with the Domestic one now having slipped a tad below its trend line as you can see below. I want to see a clear piercing of the line before issuing a “Sell” signal for this arena. However, should the markets tomorrow continue along a similar path as today, I will take that as a sign to liquidate my positions.
Here’s how we closed 11/3/2016:
Domestic TTI: -0.01% (last close +0.22%)—Buy signal effective 4/4/2016
International TTI: +1.05% (last close +1.30%)—Buy signal effective 7/19/2016
Disclosure: I am obliged to inform you that I, as well as my advisory clients, own some of the ETFs listed in the above table. Furthermore, they do not represent a specific investment recommendation for you, they merely show which ETFs from the universe I track are falling within the guidelines specified.
Contact Ulli