
- Moving the Markets
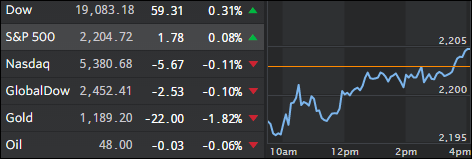
An early sell-off in the S&P 500 was short lived as Wall Street traders and computer algos stepped in and pushed the index back above its unchanged line eking out another record high as an early holiday present.
The industrial sector was the driver behind this rebound boosted by a jump in orders for durable goods in October. Again, helping matters was the continued belief that Trump’s spending plan for infrastructure projects accompanied by reduced regulations and taxes will shift economic activity into a higher gear. Let’s wait and see what really happens once the man steps into office on January 20th.
For sure, there is a lot of portfolio re-positioning going on as the shift from a slower growth environment into a hopefully faster one continues based on not only a different administration but also a different business environment. Be that as it may, I believe that, as usual, the major indexes have gotten ahead of reality and a pullback during the first 2 weeks of December would not surprise me one bit.
The markets will be closed on Thanksgiving and Friday’s session will be an abbreviated one.
Have a great Thanksgiving!
- ETFs in the Spotlight
In case you missed the announcement and description of this section, you can read it here again.
It features 10 broadly diversified ETFs from my HighVolume list as posted every Monday. Furthermore, they are screened for the lowest MaxDD% number meaning they have been showing better resistance to temporary sell offs than all others over the past year.
Here are the 10 candidates:
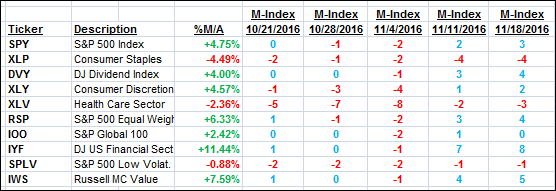
The above table simply demonstrates the magnitude with which some of the ETFs are fluctuating in regards to their positions above or below their respective individual trend lines (%M/A). A break below, represented by a negative number, shows weakness, while a break above, represented by a positive percentage, shows strength.
For hundreds of ETF choices, be sure to reference Thursday’s StatSheet.
Year to date, here’s how the above candidates have fared so far:
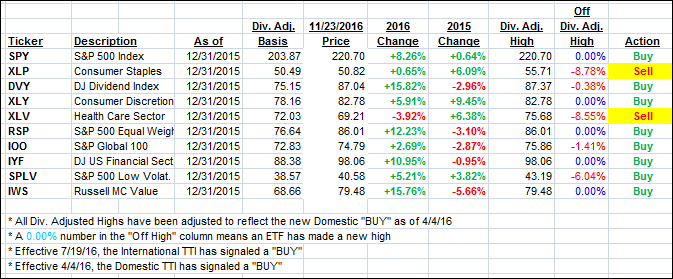
Again, the first table above shows the position of the various ETFs in relation to their respective long term trend lines (%M/A), while the second one tracks their trailing sell stops in the “Off High” column. The “Action” column will signal a “Sell” once the -7.5% point has been taken out in the “Off High” column.
- Trend Tracking Indexes (TTIs)
Our Trend Tracking Indexes (TTIs) bucked the trend of the Dow and S&P 500 and pulled back to close slighty lower.
Here’s how we closed 11/23/2016:
Domestic TTI: +1.07% (last close +1.20%)—Buy signal effective 4/4/2016
International TTI: +2.13% (last close +2.34%)—Buy signal effective 7/19/2016
Disclosure: I am obliged to inform you that I, as well as my advisory clients, own some of the ETFs listed in the above table. Furthermore, they do not represent a specific investment recommendation for you, they merely show which ETFs from the universe I track are falling within the guidelines specified.
Contact Ulli