
- Moving the Markets
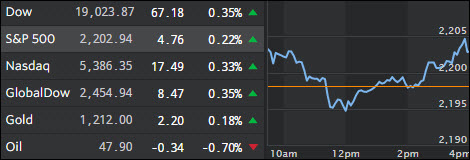
The post-election levitation continued as the major indexes edged higher with the S&P 500 and the Dow taking out new milestone markers for the first time; i.e. the 2,200 and 19,000 levels, although with low volume during this Holiday shortened week.
Again, Wall Street’s focus remains on the Trump promises of less regulations, tax cuts and the mother of all infrastructure spending, which would benefit a wide variety of industries. Especially tax cuts are in focus as they are assumed to boost earnings per share and increase the odds of a longer lasting economic expansion.
However, at this point it’s nothing but “irrational exuberance,” to use former Fed chief Greenspan’s famous words. So far, this rally is based on nothing but hope and should President-elect Trump fail to execute, or bond yields continue to spike more than expected, there will likely be a price to be paid in form of a sharp correction.
A big focus in the media has been the fact that all major indexes have closed at record highs on the same day. Well, as ZH pointed out, the last time this happened it did not work out so well, as the following chart clearly shows:
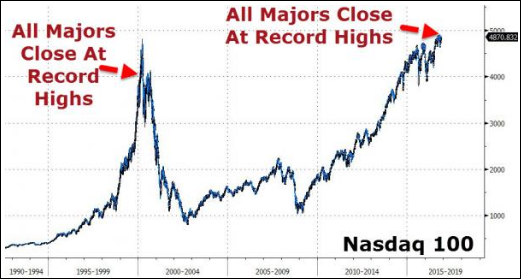
Will this time be different?
- ETFs in the Spotlight
In case you missed the announcement and description of this section, you can read it here again.
It features 10 broadly diversified ETFs from my HighVolume list as posted every Monday. Furthermore, they are screened for the lowest MaxDD% number meaning they have been showing better resistance to temporary sell offs than all others over the past year.
Here are the 10 candidates:
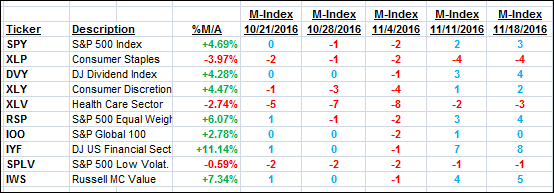
The above table simply demonstrates the magnitude with which some of the ETFs are fluctuating in regards to their positions above or below their respective individual trend lines (%M/A). A break below, represented by a negative number, shows weakness, while a break above, represented by a positive percentage, shows strength.
For hundreds of ETF choices, be sure to reference Thursday’s StatSheet.
Year to date, here’s how the above candidates have fared so far:
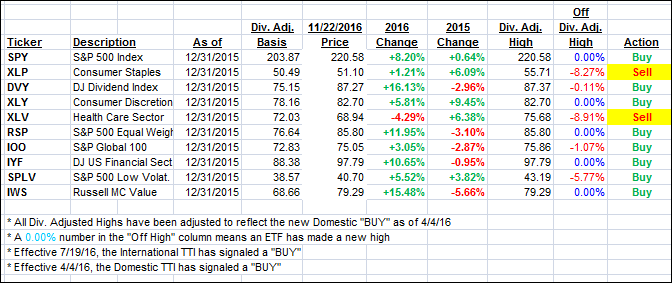
Again, the first table above shows the position of the various ETFs in relation to their respective long term trend lines (%M/A), while the second one tracks their trailing sell stops in the “Off High” column. The “Action” column will signal a “Sell” once the -7.5% point has been taken out in the “Off High” column.
- Trend Tracking Indexes (TTIs)
Our Trend Tracking Indexes (TTIs) closed higher as the major indexes continued their post-election rally.
Here’s how we closed 11/22/2016:
Domestic TTI: +1.20% (last close +1.10%)—Buy signal effective 4/4/2016
International TTI: +2.34% (last close +2.17%)—Buy signal effective 7/19/2016
Disclosure: I am obliged to inform you that I, as well as my advisory clients, own some of the ETFs listed in the above table. Furthermore, they do not represent a specific investment recommendation for you, they merely show which ETFs from the universe I track are falling within the guidelines specified.
Contact Ulli