
- Moving the Markets
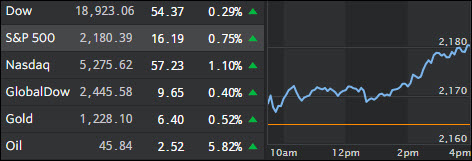
The major indexes extended their post election really with the Nasdaq being the winner of the day with a gain of +1.10%. The Dow managed to again creep into record territory while the S&P added a solid +0.75%.
Energy stocks provided the fuel with oil racing ahead with a gain of +5.82% in anticipation of the scheduled OPEC meeting the end of the month. As we’ve seen in the past, there is much hope attached to the outcome of the OPECers, but it’s far from certain as to whether their jawboning results in actual production cuts.
Helping the mood on Wall Street were improved retail sales over recent months, which suggests that maybe more spending will cast a positive light on the holidays and provide a much needed boost to the economy and the next GDP reading.
After some devastating losses over the past few days, bonds finally closed up as yields pulled back, although I think that this is just the beginning of the bursting bond bubble.
- ETFs in the Spotlight
In case you missed the announcement and description of this section, you can read it here again.
It features 10 broadly diversified ETFs from my HighVolume list as posted every Monday. Furthermore, they are screened for the lowest MaxDD% number meaning they have been showing better resistance to temporary sell offs than all others over the past year.
Here are the 10 candidates:
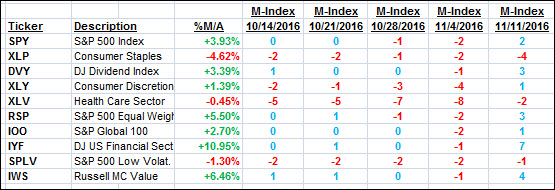
The above table simply demonstrates the magnitude with which some of the ETFs are fluctuating in regards to their positions above or below their respective individual trend lines (%M/A). A break below, represented by a negative number, shows weakness, while a break above, represented by a positive percentage, shows strength.
For hundreds of ETF choices, be sure to reference Thursday’s StatSheet.
Year to date, here’s how the above candidates have fared so far:
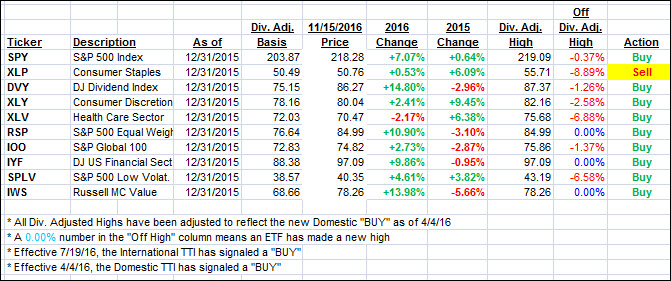
Again, the first table above shows the position of the various ETFs in relation to their respective long term trend lines (%M/A), while the second one tracks their trailing sell stops in the “Off High” column. The “Action” column will signal a “Sell” once the -7.5% point has been taken out in the “Off High” column.
- Trend Tracking Indexes (TTIs)
Our Trend Tracking Indexes (TTIs) followed the major indexes higher as Trump’s economic plan has cast optimism over the markets.
Here’s how we closed 11/15/2016:
Domestic TTI: +0.82% (last close +0.57%)—Buy signal effective 4/4/2016
International TTI: +2.42% (last close +2.01%)—Buy signal effective 7/19/2016
Disclosure: I am obliged to inform you that I, as well as my advisory clients, own some of the ETFs listed in the above table. Furthermore, they do not represent a specific investment recommendation for you, they merely show which ETFs from the universe I track are falling within the guidelines specified.
Contact Ulli