
- Moving the Markets
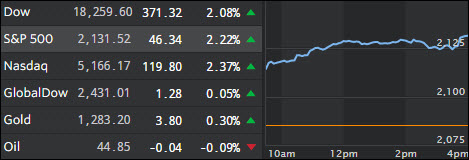
After 9 straight losing sessions, the markets shifted into high gear right out of the starting blocks to stage the best rally in 8 months. The reason was that FBI chief Comey decided that he would not press criminal charges against Hillary Clinton after just having re-opened the case 9 days ago.
This brightened the prospects for a Clinton victory, who is a favorite on Wall Street, because she represents the status quo while Trump as a president would shake up things a bit and the establishment feels unnerved by his views on foreign policy, trade and immigration.
As I posted Friday, the follow through to the downside I was looking for to validate the bearish implication of our Domestic TTI did not happen, so we remain invested until a break below the trend line materializes again. For more detail, please see the TTI data in section 3 below.
- ETFs in the Spotlight
In case you missed the announcement and description of this section, you can read it here again.
It features 10 broadly diversified ETFs from my HighVolume list as posted every Monday. Furthermore, they are screened for the lowest MaxDD% number meaning they have been showing better resistance to temporary sell offs than all others over the past year.
Here are the 10 candidates:
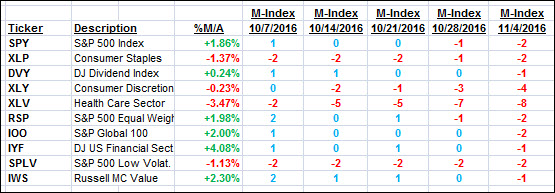
The above table simply demonstrates the magnitude with which some of the ETFs are fluctuating in regards to their positions above or below their respective individual trend lines (%M/A). A break below, represented by a negative number, shows weakness, while a break above, represented by a positive percentage, shows strength.
For hundreds of ETF choices, be sure to reference Thursday’s StatSheet.
Year to date, here’s how the above candidates have fared so far:
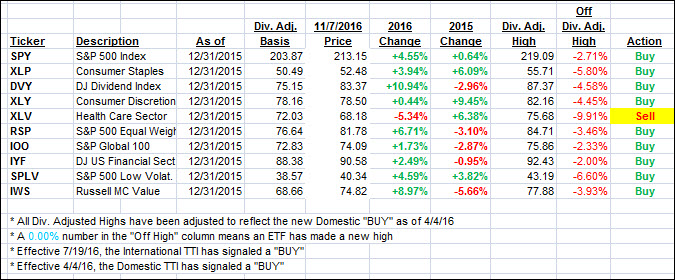
Again, the first table above shows the position of the various ETFs in relation to their respective long term trend lines (%M/A), while the second one tracks their trailing sell stops in the “Off High” column. The “Action” column will signal a “Sell” once the -7.5% point has been taken out in the “Off High” column.
- Trend Tracking Indexes (TTIs)
Our Trend Tracking Indexes (TTIs) recovered with the Domestic one moving back above its long-term trend line.
Whether this is just a temporary bounce or a resumption of the bull market remains to be seen, but if Trump were to win the elections, I think this rally would be over just as fast as it appeared. We’ll have to wait and see.
Here’s how we closed 11/7/2016:
Domestic TTI: +0.67% (last close -0.14%)—Buy signal effective 4/4/2016
International TTI: +1.84% (last close +0.50%)—Buy signal effective 7/19/2016
Disclosure: I am obliged to inform you that I, as well as my advisory clients, own some of the ETFs listed in the above table. Furthermore, they do not represent a specific investment recommendation for you, they merely show which ETFs from the universe I track are falling within the guidelines specified.
Contact Ulli