
- Moving the Markets
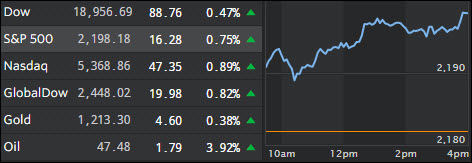
The Trump pump continued with full force as all 3 major indexes set record closing highs today supported by energy and commodity shares. Oil prices jumped and managed to gain almost 4%.
There were no actual news events driving this rally other than investors jumping on the Trump theme of massive infrastructure projects while trying to figure out which sectors might benefit the most. Optimism prevails that Trump will ease regulations and reduce taxes providing further hope that equities are the place to be with both consumers and corporations benefiting.
Additionally, with bonds having been spanked as rates rose over the past week, the flow of funds has been out of bonds and into equities with data showing that $45.7 billion were moved into equity ETFs in the past eight trading days ending Thursday, the biggest inflow on record.
Color me skeptical but this euphoria assumes that Trump will not only actually implement these campaign promises but the market is betting on ideas that haven’t even been introduced to Congress yet. Then there is the notion that we can simply continue piling new debt on top of old debt in the face of a rising interest environment. New data shows that a minor ¼% increase in rates translates to an increase in annual debt payments of $50 billion. But that’s the future; for right now let’s enjoy the rally for as along as it may last.
- ETFs in the Spotlight
In case you missed the announcement and description of this section, you can read it here again.
It features 10 broadly diversified ETFs from my HighVolume list as posted every Monday. Furthermore, they are screened for the lowest MaxDD% number meaning they have been showing better resistance to temporary sell offs than all others over the past year.
Here are the 10 candidates:
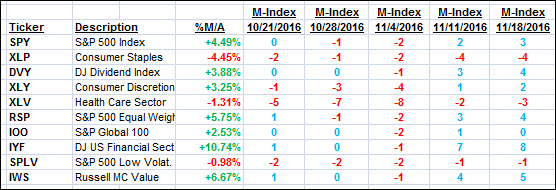
The above table simply demonstrates the magnitude with which some of the ETFs are fluctuating in regards to their positions above or below their respective individual trend lines (%M/A). A break below, represented by a negative number, shows weakness, while a break above, represented by a positive percentage, shows strength.
For hundreds of ETF choices, be sure to reference Thursday’s StatSheet.
Year to date, here’s how the above candidates have fared so far:
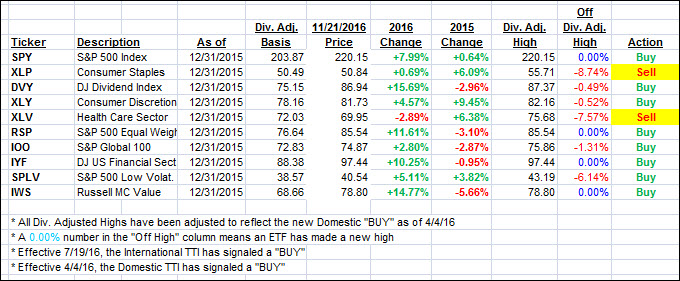
Again, the first table above shows the position of the various ETFs in relation to their respective long term trend lines (%M/A), while the second one tracks their trailing sell stops in the “Off High” column. The “Action” column will signal a “Sell” once the -7.5% point has been taken out in the “Off High” column.
- Trend Tracking Indexes (TTIs)
Our Trend Tracking Indexes (TTIs) closed higher as the major indexes continued their post-election rally.
Here’s how we closed 11/21/2016:
Domestic TTI: +1.10% (last close +0.78%)—Buy signal effective 4/4/2016
International TTI: +2.17% (last close +1.59%)—Buy signal effective 7/19/2016
Disclosure: I am obliged to inform you that I, as well as my advisory clients, own some of the ETFs listed in the above table. Furthermore, they do not represent a specific investment recommendation for you, they merely show which ETFs from the universe I track are falling within the guidelines specified.
Contact Ulli
Comments 2
Hey, Uli–you’re beginning to sound like a permabear.
Smokey
11/21/16
Smokey,
Just trying to keep some realism in a distorted market environment… 🙂
Ulli…