
- Moving the Markets
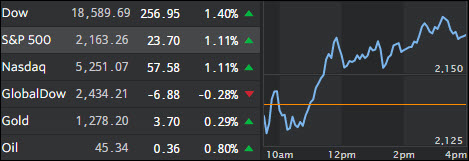
It’s hard to put the market action of the past 24 hours into words. As Trump’s election victory became apparent last night, volatility shifted into overdrive and stock futures headed sharply south triggering the “limit down” trading stop after having lost 5%.
For sure, you thought today would have turned into a bloodbath on Wall Street right from the opening. Those were my thoughts as well, and I was prepared to pull the trigger on our equity holdings this morning. However, much to my surprise the markets had recovered and were hovering around the unchanged line before staging a massive rebound rally, which was the best day-after-presidential-election since Reagan in 1980 (hat tip to ZH for this stat).
The bloodbath actually happened in bonds, especially in the 10 year Treasury, whose yield spiked to 2% with a range of almost 40 basis points from low to high, which was the the biggest percentage move in 10-year yields ever. In the end, there was no negative effect on our Trend Tracking Indexes, and we remain in “Buy” mode for the time being.
With bond yields moving higher, without the Fed’s intervention, the question is whether this rally is sustainable or simply position adjustments in the markets to reflect new realities associated with the Trump win. We may see more clarity in this current high volatility environment as things hopefully calm down over the next week or so.
In case you missed it, here the stock futures chart from last night in all its glory showing the massive dump:
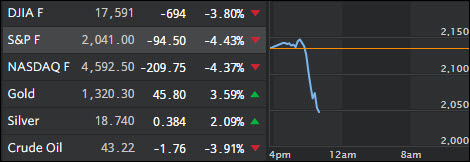
The screen shot was taken on 11/8/16 at 7:40 PM PST.
- ETFs in the Spotlight
In case you missed the announcement and description of this section, you can read it here again.
It features 10 broadly diversified ETFs from my HighVolume list as posted every Monday. Furthermore, they are screened for the lowest MaxDD% number meaning they have been showing better resistance to temporary sell offs than all others over the past year.
Here are the 10 candidates:
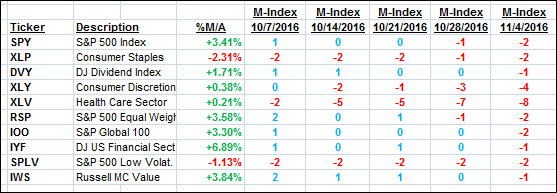
The above table simply demonstrates the magnitude with which some of the ETFs are fluctuating in regards to their positions above or below their respective individual trend lines (%M/A). A break below, represented by a negative number, shows weakness, while a break above, represented by a positive percentage, shows strength.
For hundreds of ETF choices, be sure to reference Thursday’s StatSheet.
Year to date, here’s how the above candidates have fared so far:
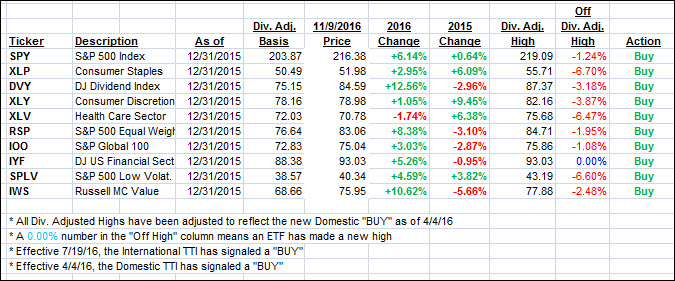
Again, the first table above shows the position of the various ETFs in relation to their respective long term trend lines (%M/A), while the second one tracks their trailing sell stops in the “Off High” column. The “Action” column will signal a “Sell” once the -7.5% point has been taken out in the “Off High” column.
- Trend Tracking Indexes (TTIs)
Our Trend Tracking Indexes (TTIs) improved and moved deeper into bullish territory after having briefly dipped below the line last week. Despite today’s rebound, we remain alert to possible reversals as volatility could return with a vengeance.
Here’s how we closed 11/9/2016:
Domestic TTI: +1.02% (last close +0.76%)—Buy signal effective 4/4/2016
International TTI: +2.55% (last close +2.00%)—Buy signal effective 7/19/2016
Disclosure: I am obliged to inform you that I, as well as my advisory clients, own some of the ETFs listed in the above table. Furthermore, they do not represent a specific investment recommendation for you, they merely show which ETFs from the universe I track are falling within the guidelines specified.
Contact Ulli