
- Moving the Markets
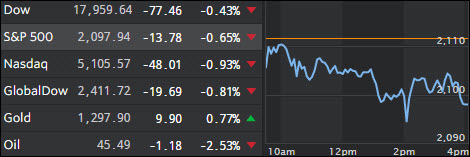
Even the Fed with their announcement of leaving interest rates unchanged could not prevent the major indexes from slipping for the 7th day in a row, which represents their longest losing streak in 5 years. However, when looking at the actual numbers it translates to a loss of only -2.5% for the S&P 500; hardly an earthshaking number.
Supporting this weakness was the fact that the Fed signaled that a December hike was in the cards and that they allegedly don’t need any more evidence before moving, that is if you translate their subtle announcement correctly.
What is more critical is the fact that this 7-day slippage was enough to propel our Domestic Trend Tracking Index (TTI) to the cusp of a new “Sell” signal, as you can see in section 3 below.
At this point in time, it’s always interesting to see if there are other indicators that are confirming a potential move into bear market territory. ZeroHedge featured 2 charts, which are indicative of the environment we are currently in. Take a look:
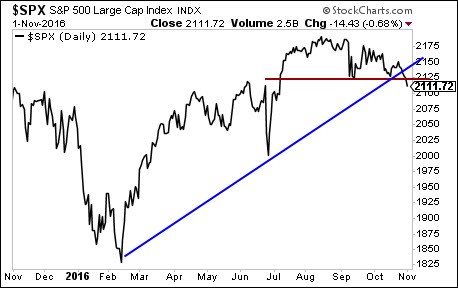
It shows how the S&P 500 has clearly broken its long-term uptrend line and also it’s short-term support level. If this continues, expect downward momentum to accelerate.
For some idea as to how far down we might go, take a look at what I call the “reality” chart, which measures the S&P 500 vs. Earnings:
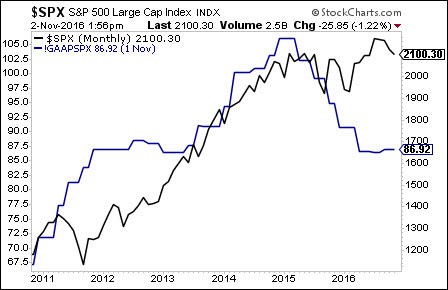
I believe that eventually the level of the S&P has to align with earnings, which means either earnings go way up or the index comes way down to a reality level in the 1,600s.
The only question is will it be now, during the coming bear market cycle, or will it be later. Your guess is as good as mine, but it pays to be prepared just in case the election hangover pulls the rug out from under the markets.
- ETFs in the Spotlight
In case you missed the announcement and description of this section, you can read it here again.
It features 10 broadly diversified ETFs from my HighVolume list as posted every Monday. Furthermore, they are screened for the lowest MaxDD% number meaning they have been showing better resistance to temporary sell offs than all others over the past year.
Here are the 10 candidates:
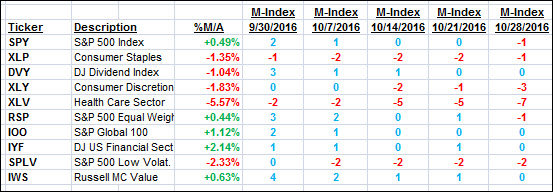
The above table simply demonstrates the magnitude with which some of the ETFs are fluctuating in regards to their positions above or below their respective individual trend lines (%M/A). A break below, represented by a negative number, shows weakness, while a break above, represented by a positive percentage, shows strength.
For hundreds of ETF choices, be sure to reference Thursday’s StatSheet.
Year to date, here’s how the above candidates have fared so far:
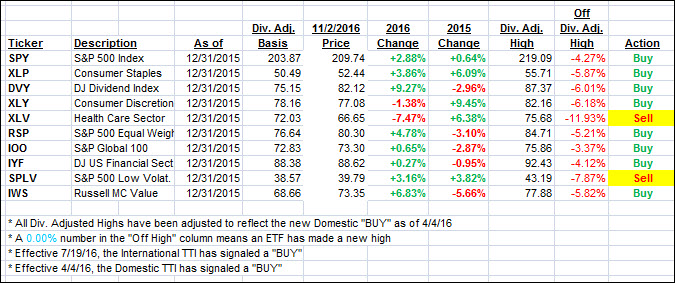
Again, the first table above shows the position of the various ETFs in relation to their respective long term trend lines (%M/A), while the second one tracks their trailing sell stops in the “Off High” column. The “Action” column will signal a “Sell” once the -7.5% point has been taken out in the “Off High” column.
- Trend Tracking Indexes (TTIs)
Our Trend Tracking Indexes (TTIs) continued south and are getting closer to a trend line break into bear market territory. As of today, we still remain on the bullish side, but that could change in a hurry. Be sure to stay tuned so you don’t miss the announcement if the break below the line materializes.
Here’s how we closed 11/2/2016:
Domestic TTI: +0.22% (last close +0.47%)—Buy signal effective 4/4/2016
International TTI: +1.30% (last close +2.00%)—Buy signal effective 7/19/2016
Disclosure: I am obliged to inform you that I, as well as my advisory clients, own some of the ETFs listed in the above table. Furthermore, they do not represent a specific investment recommendation for you, they merely show which ETFs from the universe I track are falling within the guidelines specified.
Contact Ulli