
- Moving the Markets
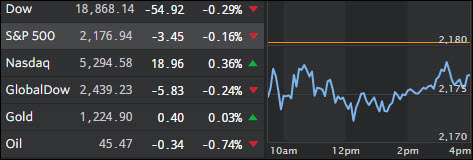
It was a mixed day with the S&P meandering slightly below its unchanged line caused by Wall Street digesting a healthy dose of economic data points. Industrial production tanked again and has now contracted for the 14th straight month, which is its longest non-recessionary streak in 96 years. To look at it another way, this is the biggest 2-year decline since the middle of 2008.
At the same time mortgage applications crashed 30% to 10-month lows, which was not really a surprise considering that mortgage rates surged and approached 4%.
Given that, it came as a total surprise that the December Fed rate-hike odds are now near 100%. Yes, that is not a misprint; even deteriorating economic data don’t matter as the anticipated spending wave to be implemented by the new incoming Trump administration takes priority.
It sure does not make sense when looking at this chart, courtesy of ZH:
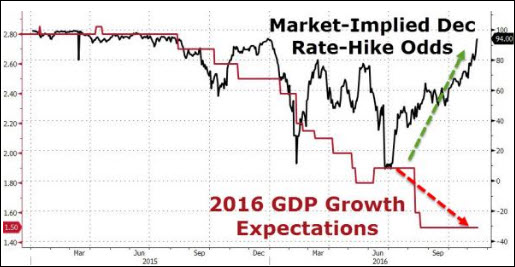
It’s clear that rate hike odds are way out of whack with past GDP expectations, which makes me wonder if these odds could break down to meet the GDP number before the Fed meets again on December 14th.
- ETFs in the Spotlight
In case you missed the announcement and description of this section, you can read it here again.
It features 10 broadly diversified ETFs from my HighVolume list as posted every Monday. Furthermore, they are screened for the lowest MaxDD% number meaning they have been showing better resistance to temporary sell offs than all others over the past year.
Here are the 10 candidates:
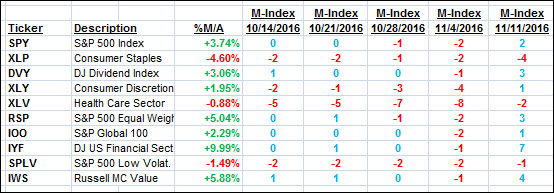
The above table simply demonstrates the magnitude with which some of the ETFs are fluctuating in regards to their positions above or below their respective individual trend lines (%M/A). A break below, represented by a negative number, shows weakness, while a break above, represented by a positive percentage, shows strength.
For hundreds of ETF choices, be sure to reference Thursday’s StatSheet.
Year to date, here’s how the above candidates have fared so far:
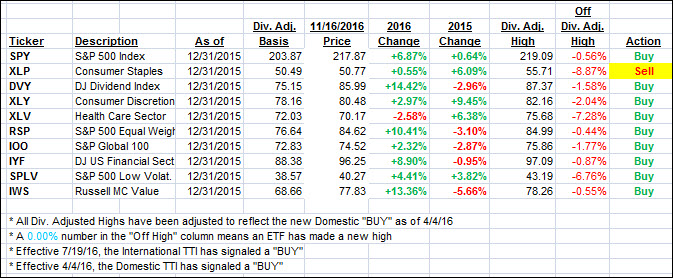
Again, the first table above shows the position of the various ETFs in relation to their respective long term trend lines (%M/A), while the second one tracks their trailing sell stops in the “Off High” column. The “Action” column will signal a “Sell” once the -7.5% point has been taken out in the “Off High” column.
- Trend Tracking Indexes (TTIs)
Our Trend Tracking Indexes (TTIs) were mixed today with the Domestic one inching higher while the International one pulled back.
Here’s how we closed 11/16/2016:
Domestic TTI: +0.89% (last close +0.82%)—Buy signal effective 4/4/2016
International TTI: +1.96% (last close +2.42%)—Buy signal effective 7/19/2016
Disclosure: I am obliged to inform you that I, as well as my advisory clients, own some of the ETFs listed in the above table. Furthermore, they do not represent a specific investment recommendation for you, they merely show which ETFs from the universe I track are falling within the guidelines specified.
Contact Ulli