
1. Moving the Markets
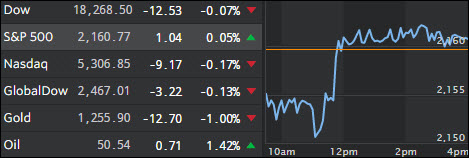
The markets were definitely mired in uncertainty, as an early sell-off reversed and pulled the major indexes back up close to the unchanged line. As the chart above shows, the S&P traded within a 2 point range for some 4 hours all in anticipation of tomorrow’s jobs numbers.
Traders hope that they will shed some light as whether the Fed will continue with its “bark and no bite” policy or succumb to the need for “more data” to avoid having to make a rate hike decision that surely will rattle markets. November and December rate hike odds have risen sharply.
In regards to market reaction to either a weak or strong jobs number, it does not really matter. If this year’s history is any indication, the S&P 500 will rally no matter what according to these spot on charts from ZH. Take a look:

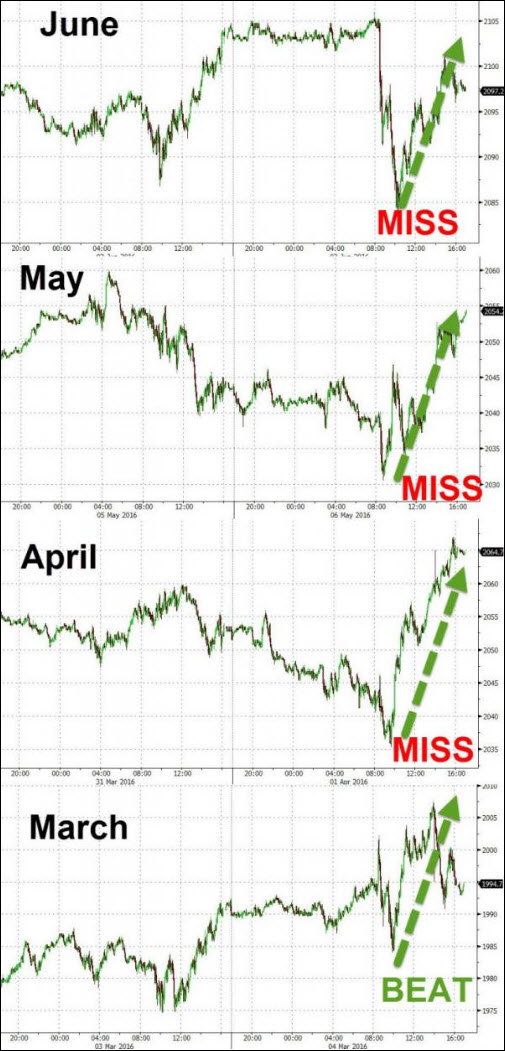
You just simply have to laugh at the amount of manipulation involved.
2. ETFs in the Spotlight
In case you missed the announcement and description of this section, you can read it here again.
It features 10 broadly diversified ETFs from my HighVolume list as posted every Monday. Furthermore, they are screened for the lowest MaxDD% number meaning they have been showing better resistance to temporary sell offs than all others over the past year.
Here are the 10 candidates:
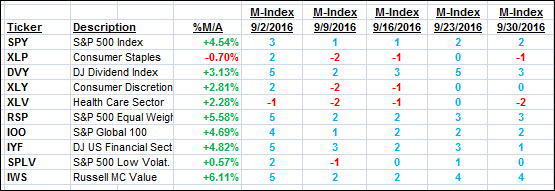
The above table simply demonstrates the magnitude with which some of the ETFs are fluctuating in regards to their positions above or below their respective individual trend lines (%M/A). A break below, represented by a negative number, shows weakness, while a break above, represented by a positive percentage, shows strength.
For hundreds of ETF choices, be sure to reference Thursday’s StatSheet.
Year to date, here’s how the above candidates have fared so far:
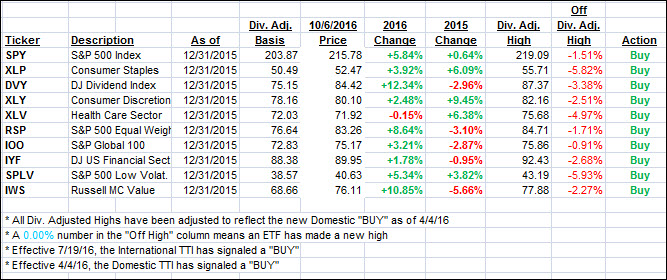
Again, the first table above shows the position of the various ETFs in relation to their respective long term trend lines (%M/A), while the second one tracks their trailing sell stops in the “Off High” column. The “Action” column will signal a “Sell” once the -7.5% point has been taken out in the “Off High” column.
3. Trend Tracking Indexes (TTIs)
Our Trend Tracking Indexes (TTIs) went nowhere as the Major indexs remained just about unchanged in anticipation of tomorrow’s jobs report.
Here’s how we closed 10/6/2016:
Domestic TTI: +2.14% (last close +2.14%)—Buy signal effective 4/4/2016
International TTI: +4.69% (last close +4.88%)—Buy signal effective 7/19/2016
Disclosure: I am obliged to inform you that I, as well as my advisory clients, own some of the ETFs listed in the above table. Furthermore, they do not represent a specific investment recommendation for you, they merely show which ETFs from the universe I track are falling within the guidelines specified.
Contact Ulli