
1. Moving the Markets
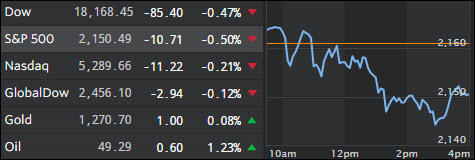
With no economic data points being published today, trading was extremely choppy with the major indexes vacillating around the unchanged line until bearish sentiment took over. A last hour rebound limited the damage in the S&P to about -0.5%, a very minor pullback given the bubble territory the markets are hovering in.
The US dollar rallied after some hawkish comments from the Fed about the likelihood of an interest rate hike in the coming months, which pulled bonds and equities down, while precious metals were taken behind the barn for a spanking. Gold dipped to its lowest level since the Brexit vote 3 months ago. The worst performer of the day was utilities, while Financials were the best in the absence of any negative news from Deutsche Bank.
Tomorrow, the economic calendar will heat up again with reports about the non-manufacturing index and the services PMI index being on deck. I expect these data points to come in soft confirming the temporary weakness in the economy.
2. ETFs in the Spotlight
In case you missed the announcement and description of this section, you can read it here again.
It features 10 broadly diversified ETFs from my HighVolume list as posted every Monday. Furthermore, they are screened for the lowest MaxDD% number meaning they have been showing better resistance to temporary sell offs than all others over the past year.
Here are the 10 candidates:
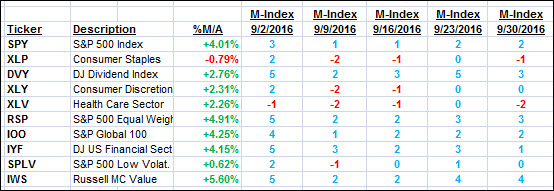
The above table simply demonstrates the magnitude with which some of the ETFs are fluctuating in regards to their positions above or below their respective individual trend lines (%M/A). A break below, represented by a negative number, shows weakness, while a break above, represented by a positive percentage, shows strength.
For hundreds of ETF choices, be sure to reference Thursday’s StatSheet.
Year to date, here’s how the above candidates have fared so far:
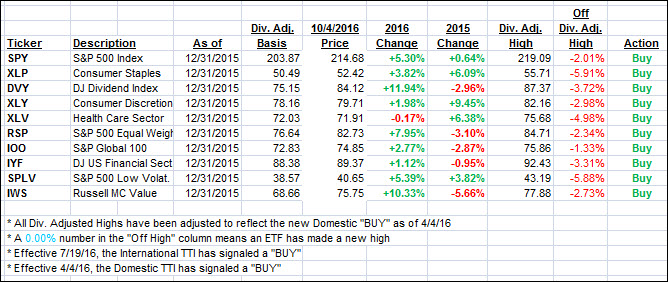
Again, the first table above shows the position of the various ETFs in relation to their respective long term trend lines (%M/A), while the second one tracks their trailing sell stops in the “Off High” column. The “Action” column will signal a “Sell” once the -7.5% point has been taken out in the “Off High” column.
3. Trend Tracking Indexes (TTIs)
Our Trend Tracking Indexes (TTIs) were mixed with the Domestic one sliding while the International one remained unchanged.
Here’s how we closed 10/4/2016:
Domestic TTI: +2.03% (last close +2.24%)—Buy signal effective 4/4/2016
International TTI: +4.68% (last close +4.68%)—Buy signal effective 7/19/2016
Disclosure: I am obliged to inform you that I, as well as my advisory clients, own some of the ETFs listed in the above table. Furthermore, they do not represent a specific investment recommendation for you, they merely show which ETFs from the universe I track are falling within the guidelines specified.
Contact Ulli
Comments 1
Hi Ulli. Just watched the UK Prime Minister’s keynote speech at the Conservative Party conference here in the UK. Thought you might like to watch it if it is shown on any Stateside TV channel.