
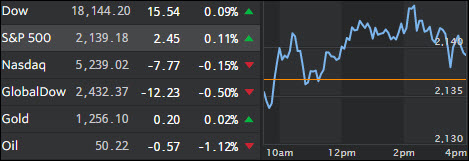
1. Moving the Markets
Despite great anticipation, the Fed minutes turned out to be a dud, as the usual jawboning concluded with “policy makers judged a rate hike could be warranted ‘relatively soon,’ if the economy continues to strengthen.” Of course, I did not expect any changes prior to the election since the Fed is in support of the incumbent party.
On the other hand, a December hike is not a certain thing either, especially if job openings, Fed chief Yellen’s favorite market indicator, continue to plunge. Today’s report showed the August number of job openings tumbling by some 388k, which was the lowest in a year.
At day’s end, the major indexes went nowhere with the Dow and S&P slightly gaining while the Nasdaq retreated a tad. I expect this sideways trend to continue through the elections but would not be surprised if volatility picks up again, especially if a known systemic problem, such as Deutsche Bank, makes negative headlines again, which could affect market direction suddenly and without warning.
2. ETFs in the Spotlight
In case you missed the announcement and description of this section, you can read it here again.
It features 10 broadly diversified ETFs from my HighVolume list as posted every Monday. Furthermore, they are screened for the lowest MaxDD% number meaning they have been showing better resistance to temporary sell offs than all others over the past year.
Here are the 10 candidates:
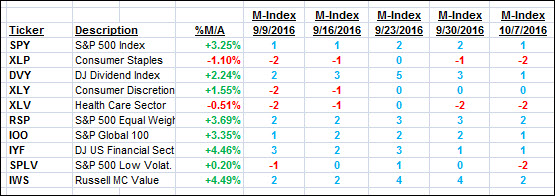
The above table simply demonstrates the magnitude with which some of the ETFs are fluctuating in regards to their positions above or below their respective individual trend lines (%M/A). A break below, represented by a negative number, shows weakness, while a break above, represented by a positive percentage, shows strength.
For hundreds of ETF choices, be sure to reference Thursday’s StatSheet.
Year to date, here’s how the above candidates have fared so far:
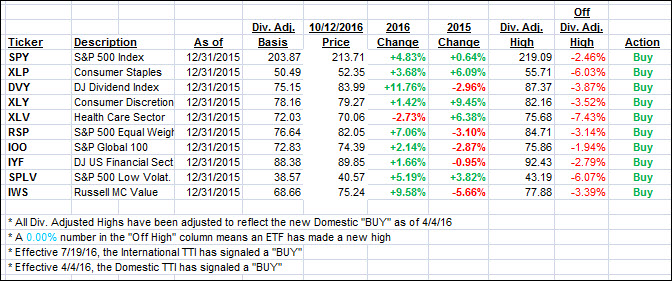
Again, the first table above shows the position of the various ETFs in relation to their respective long term trend lines (%M/A), while the second one tracks their trailing sell stops in the “Off High” column. The “Action” column will signal a “Sell” once the -7.5% point has been taken out in the “Off High” column.
3. Trend Tracking Indexes (TTIs)
Our Trend Tracking Indexes (TTIs) were mixed as the intra-day trend was predominantly sideways.
Here’s how we closed 10/12/2016:
Domestic TTI: +1.62% (last close +1.58%)—Buy signal effective 4/4/2016
International TTI: +3.22% (last close +3.28%)—Buy signal effective 7/19/2016
Disclosure: I am obliged to inform you that I, as well as my advisory clients, own some of the ETFs listed in the above table. Furthermore, they do not represent a specific investment recommendation for you, they merely show which ETFs from the universe I track are falling within the guidelines specified.
Contact Ulli