
ETF Tracker StatSheet
————————————————————-
————————————————————
Market Commentary
SUBDUED JOBS REPORT IS A NON-EVENT
1. Moving the Markets
Reaction to the September jobs report was subdued at best as the print came in at a gain of 156k, which was weaker than expected. The theme was the same as in previous months in that part-time jobs surged, full-time jobs dipped and multiple job holders jumped. In other words, more than 50% of the jobs added went to minimum wage workers. That’s not really the stuff necessary to confirm a growing economy, which is why wage growth is pretty much absent with the exception of mandatory minimum wage increases.
What that translates to is that the feared upcoming rate hike in November is out the window and December has become very questionable as rate hike odds have tumbled. Of course, things can change as the Fed has two more jobs reports on deck before their final meeting for 2016 in mid-December.
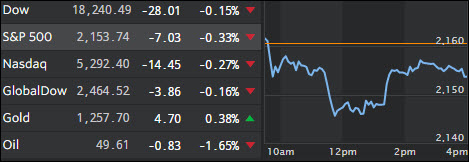
The major indexes meandered mainly below the unchanged line with the S&P 500 closing down -0.33% for the day and -0.65% for the week. The best performer for the day was Healthcare while Basic Materials were the laggard.
2. ETFs in the Spotlight
In case you missed the announcement and description of this section, you can read it here again.
It features 10 broadly diversified ETFs from my HighVolume list as posted every Monday. Furthermore, they are screened for the lowest MaxDD% number meaning they have been showing better resistance to temporary sell offs than all others over the past year.
Here are the 10 candidates:
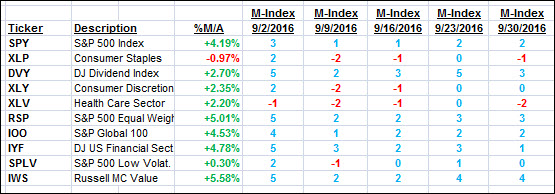
The above table simply demonstrates the magnitude with which some of the ETFs are fluctuating in regards to their positions above or below their respective individual trend lines (%M/A). A break below, represented by a negative number, shows weakness, while a break above, represented by a positive percentage, shows strength.
For hundreds of ETF choices, be sure to reference Thursday’s StatSheet.
Year to date, here’s how the above candidates have fared so far:
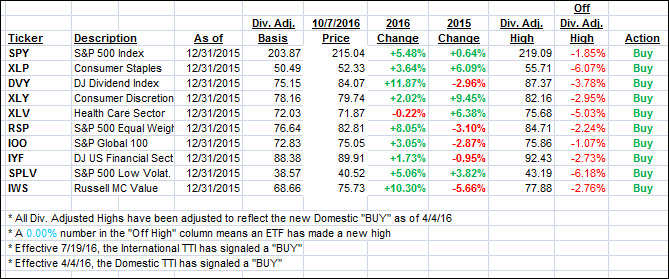
Again, the first table above shows the position of the various ETFs in relation to their respective long term trend lines (%M/A), while the second one tracks their trailing sell stops in the “Off High” column. The “Action” column will signal a “Sell” once the -7.5% point has been taken out in the “Off High” column.
3. Trend Tracking Indexes (TTIs)
Both of our Trend Tracking Indexes (TTIs) slipped with the major indexes not making any headway this week.
Here’s how we closed 10/7/2016:
Domestic TTI: +1.89% (last Friday +2.38%)—Buy signal effective 4/4/2016
International TTI: +4.12% (last Friday +4.60%)—Buy signal effective 7/19/2016
Have a great weekend.
Ulli…
Disclosure: I am obliged to inform you that I, as well as my advisory clients, own some of the ETFs listed in the above table. Furthermore, they do not represent a specific investment recommendation for you, they merely show which ETFs from the universe I track are falling within the guidelines specified.
————————————————————-
READER Q & A FOR THE WEEK
All Reader Q & A’s are listed at our web site!
Check it out at:
https://theetfbully.com/questions-answers/
———————————————————-
WOULD YOU LIKE TO HAVE YOUR INVESTMENTS PROFESSIONALLY MANAGED?
Do you have the time to follow our investment plans yourself? If you are a busy professional who would like to have his portfolio managed using our methodology, please contact me directly or get more details at:
https://theetfbully.com/personal-investment-management/
———————————————————
Back issues of the ETF/No Load Fund Tracker are available on the web at:
https://theetfbully.com/newsletter-archives/
Contact Ulli